The interplay of the assessment and the dashboard results in a “flywheel” – Constantly optimizing and tracking the most relevant KPls

Digital Performance Dashboard
Generating Meaningful Business Insights
Dashboard and Assessment - The story
The digital maturity score and the performance dashboard are the main pillars of the digital maturity program

Main Targets - Performance Dashboard
Our goal is to support you boosting digitally initiated business by …
… providing the opportunity of short-term performance measuring and tracking of your digital maturity evolution
To kick off, we have chosen a top-down approach, because it connects seamless
As next steps, we are planning

Basis of the digital performance dashboard are the DIB(new) and a driver tree logic

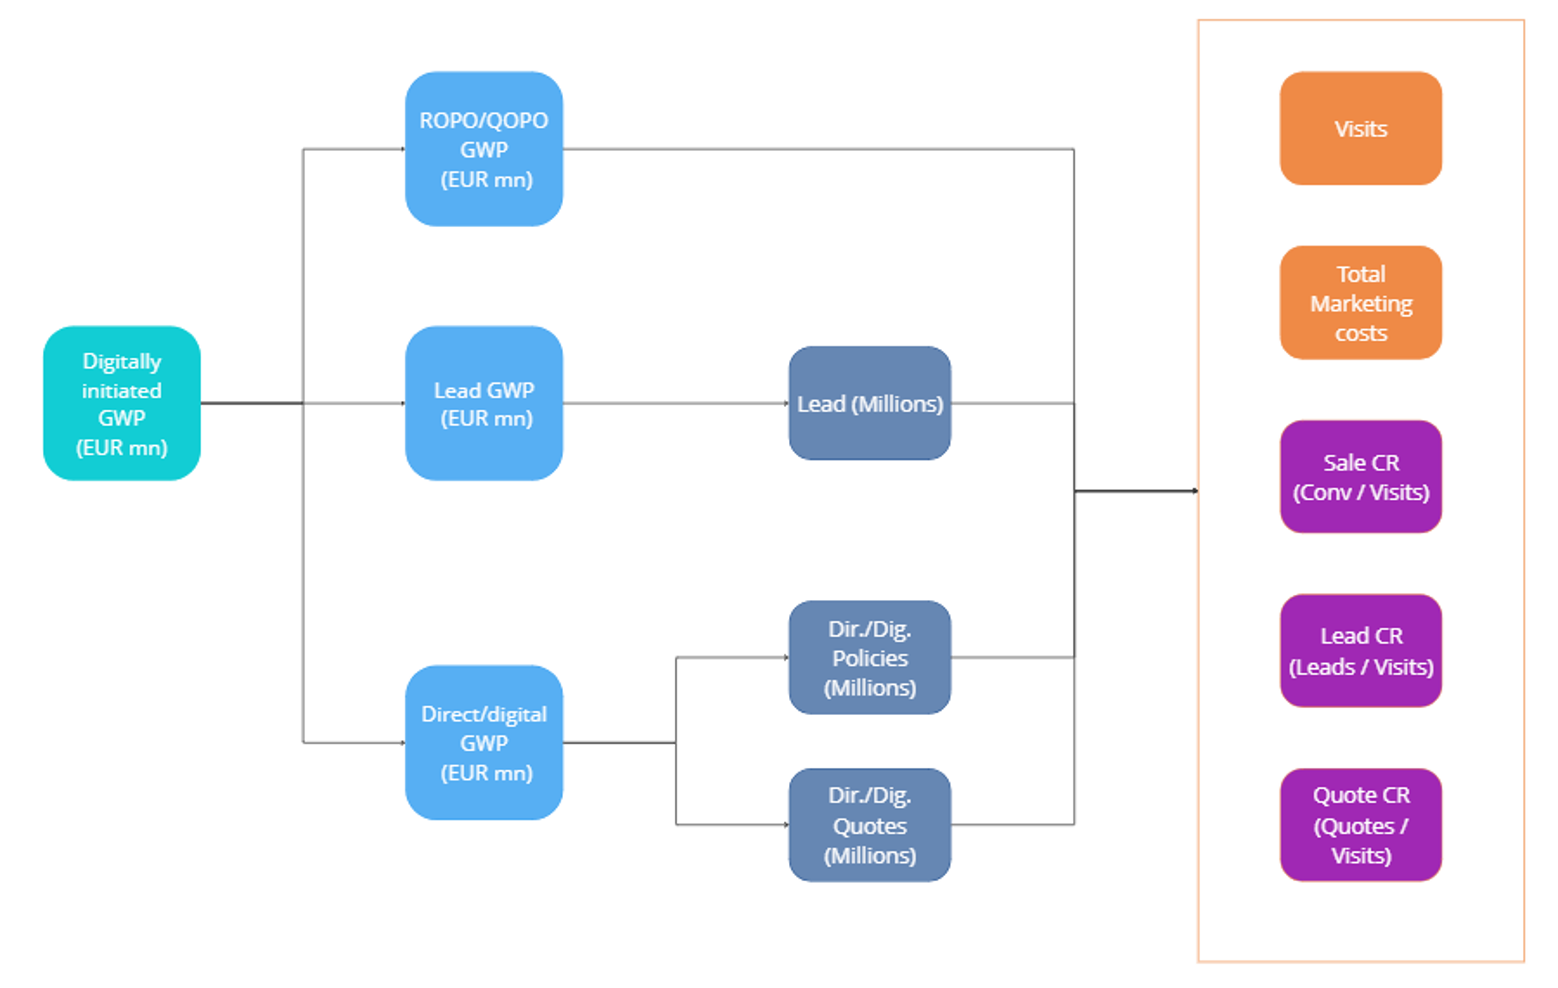
MVP - Driver Tree
What is the idea behind the MVP – Driver Tree?
The MVP (Most Valuable Performance) Driver Tree is intended to enable the most important digitally initiated KPIs to be viewed in their dependency at a glance. The most important KPIs were adapted from the extended and detailed Driver Tree seen in the following slides.
Most Valuable Performance Report - Driver Tree
Pros
Key Benefits – Driver Tree & Dashboards
What are the core questions that Driver Tree & Dashboards can answer?
Status / Challenges
The KPI Dashboard has had good progress until now although we are still facing challenges
Status Quo
It‘s planned to deliver the Performance Dashboard until end of Q3 for all OE‘s that deliver data
We are still facing some challenges with the completeness and the quality of the data

Screenshots from the Live Demo


The way forward Discussion
Level up digital maturity through customer centricity - from a channel perspective towards a customer view

Takeaways from Breakout Sessions
- LoB view
- Full funnel approach, including brand marketing activities
- KPIs about customer centricity: Customer Loyalty and Customer Lifetime Value (CLV)
.jpeg)