Digital Analytics System: Demo

How Single Page applications are tracked with the Digital Analytics System


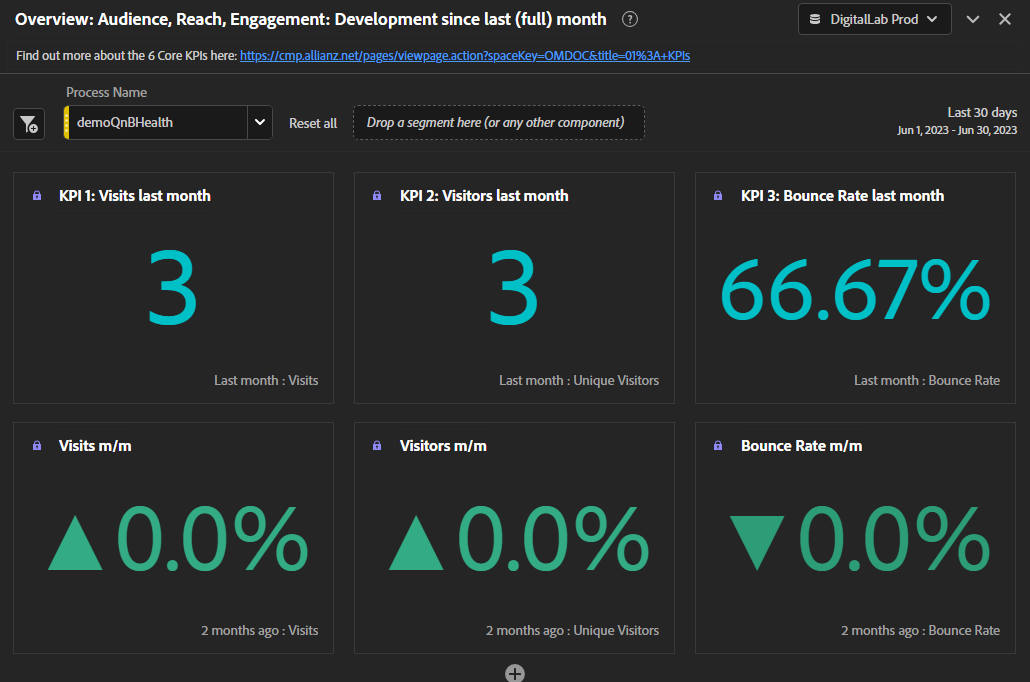
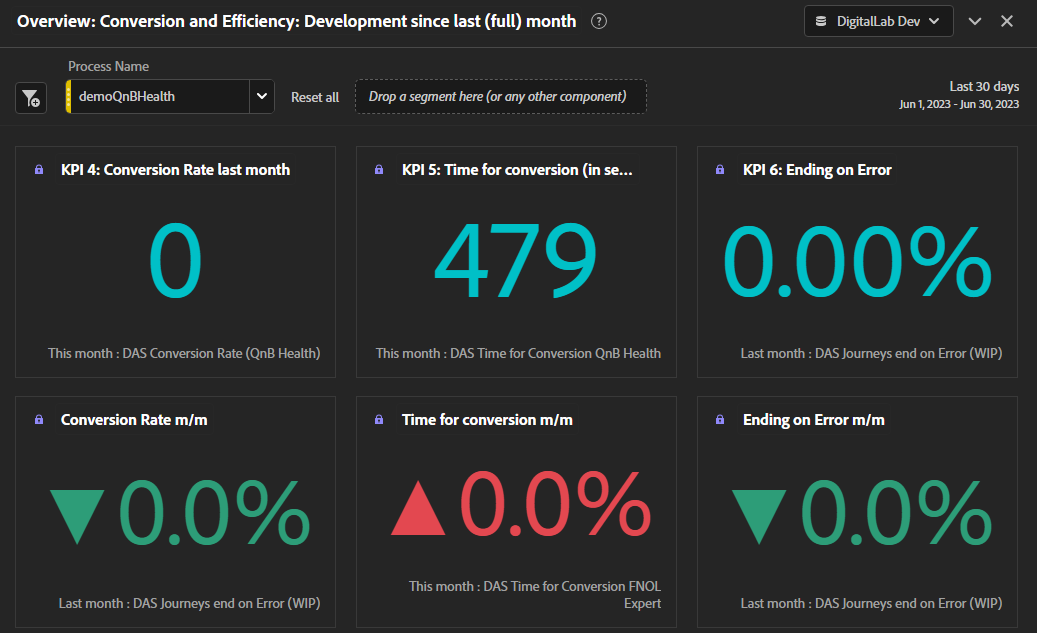
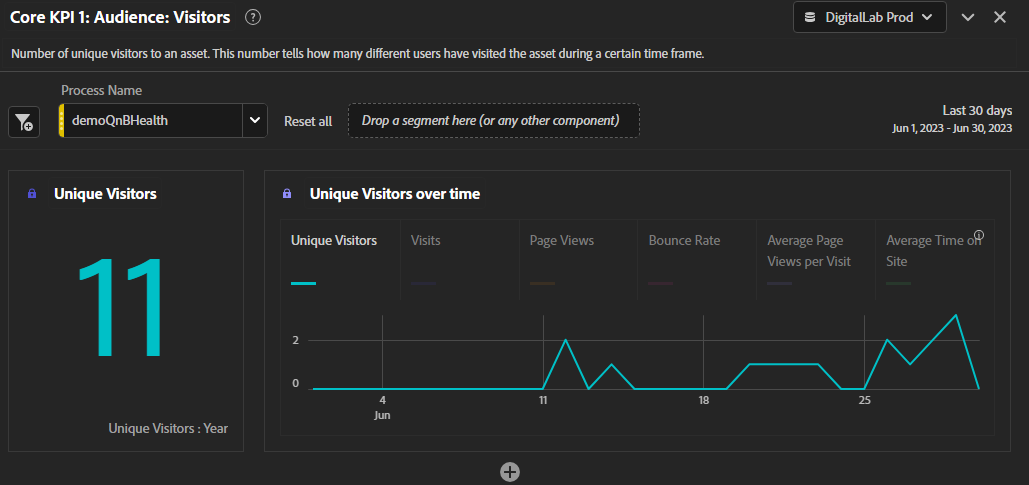
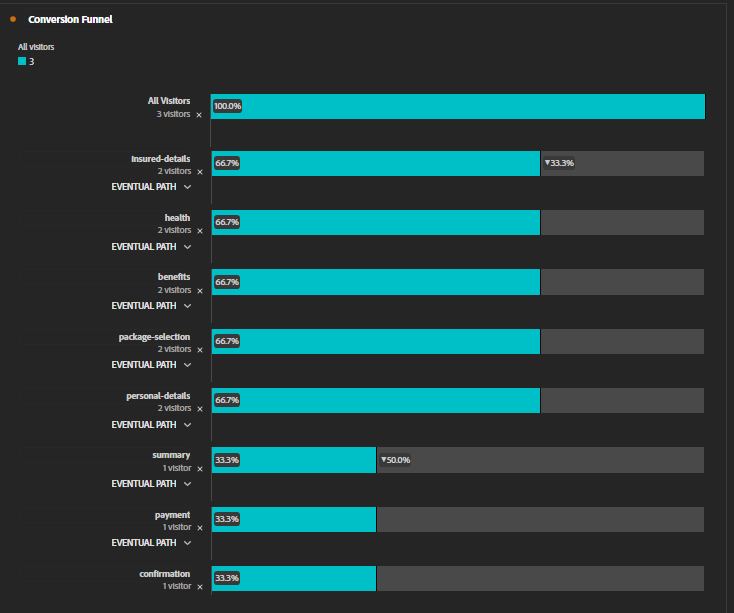
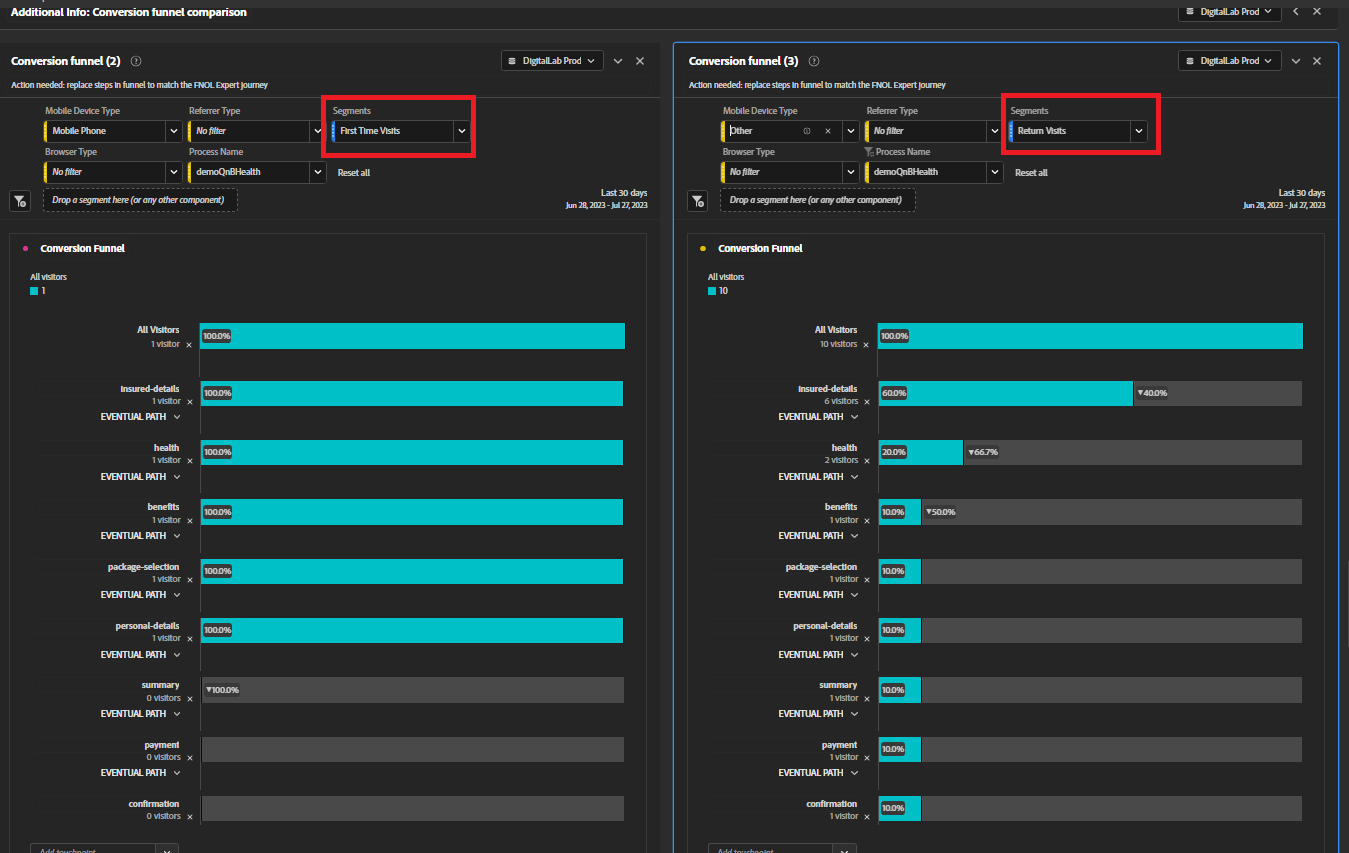
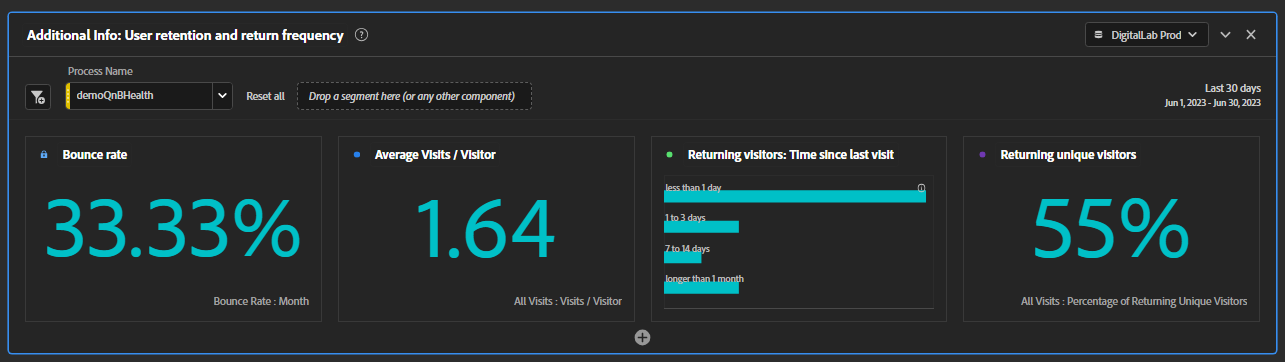
To give you a better sense of how the Digital Analytics System (DAS) works in practice, we've included a small demo below with some of the core tracking functionalities built in. Before we move to the user journey, you can explore some screenshots of a real dashboard we created as a part of our level 1 tracking.

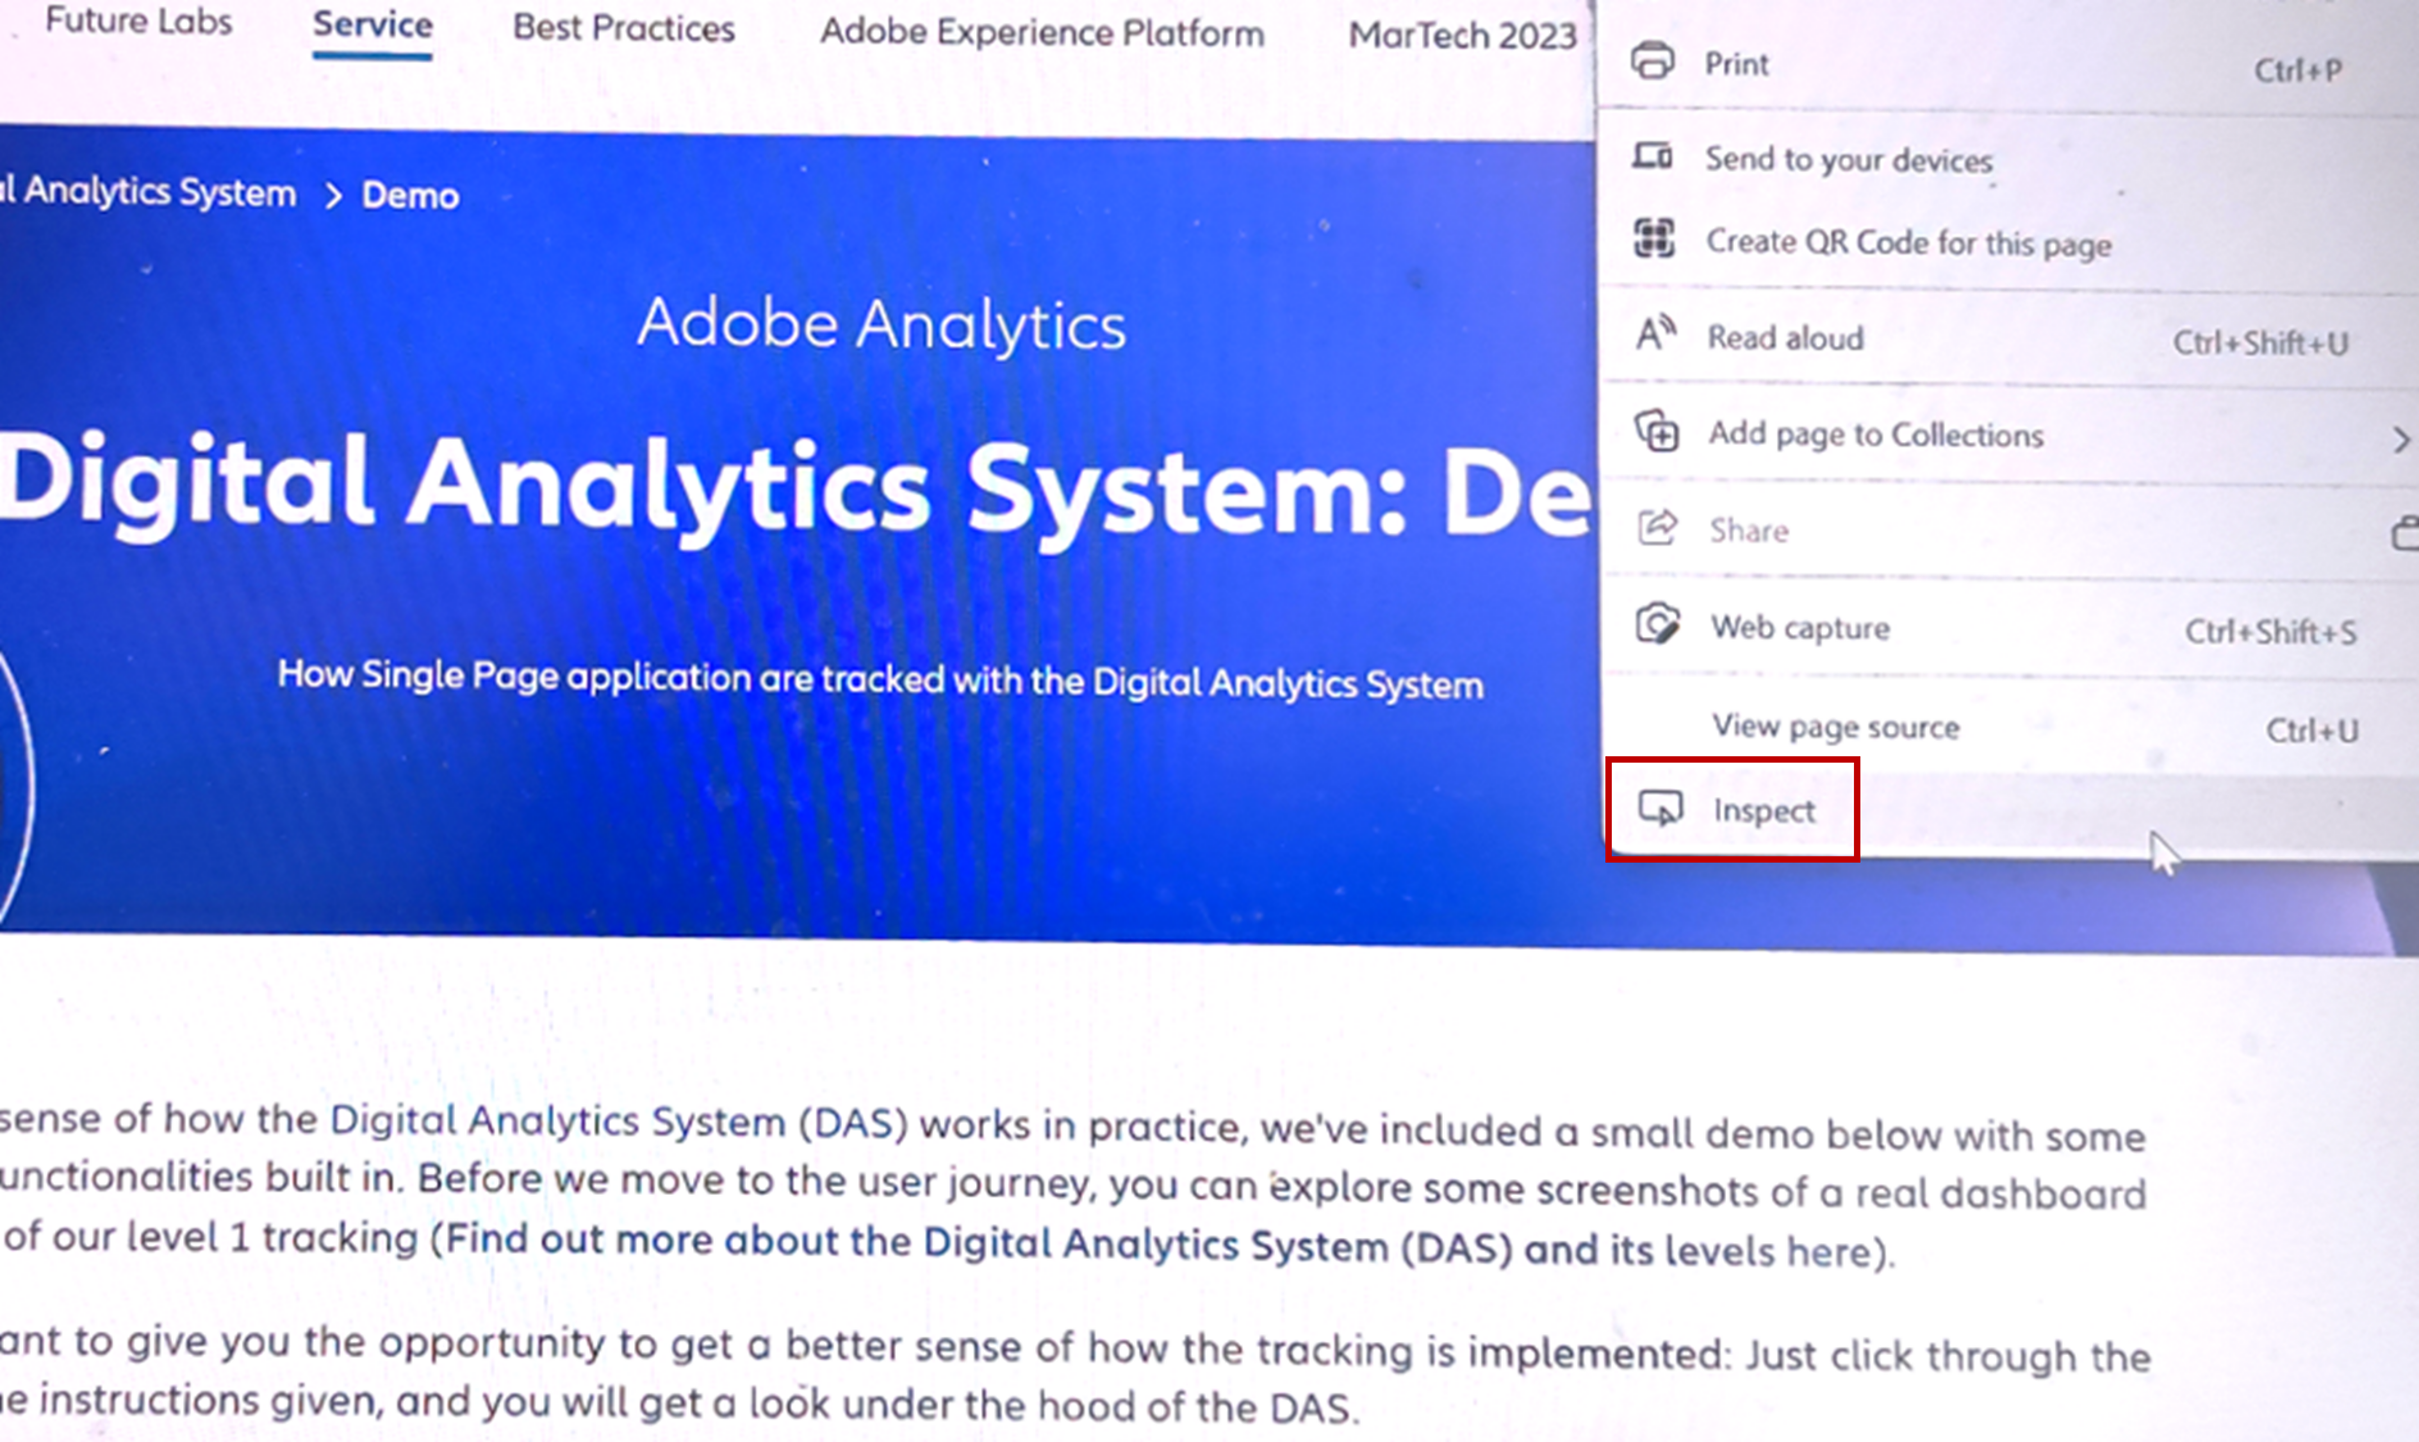
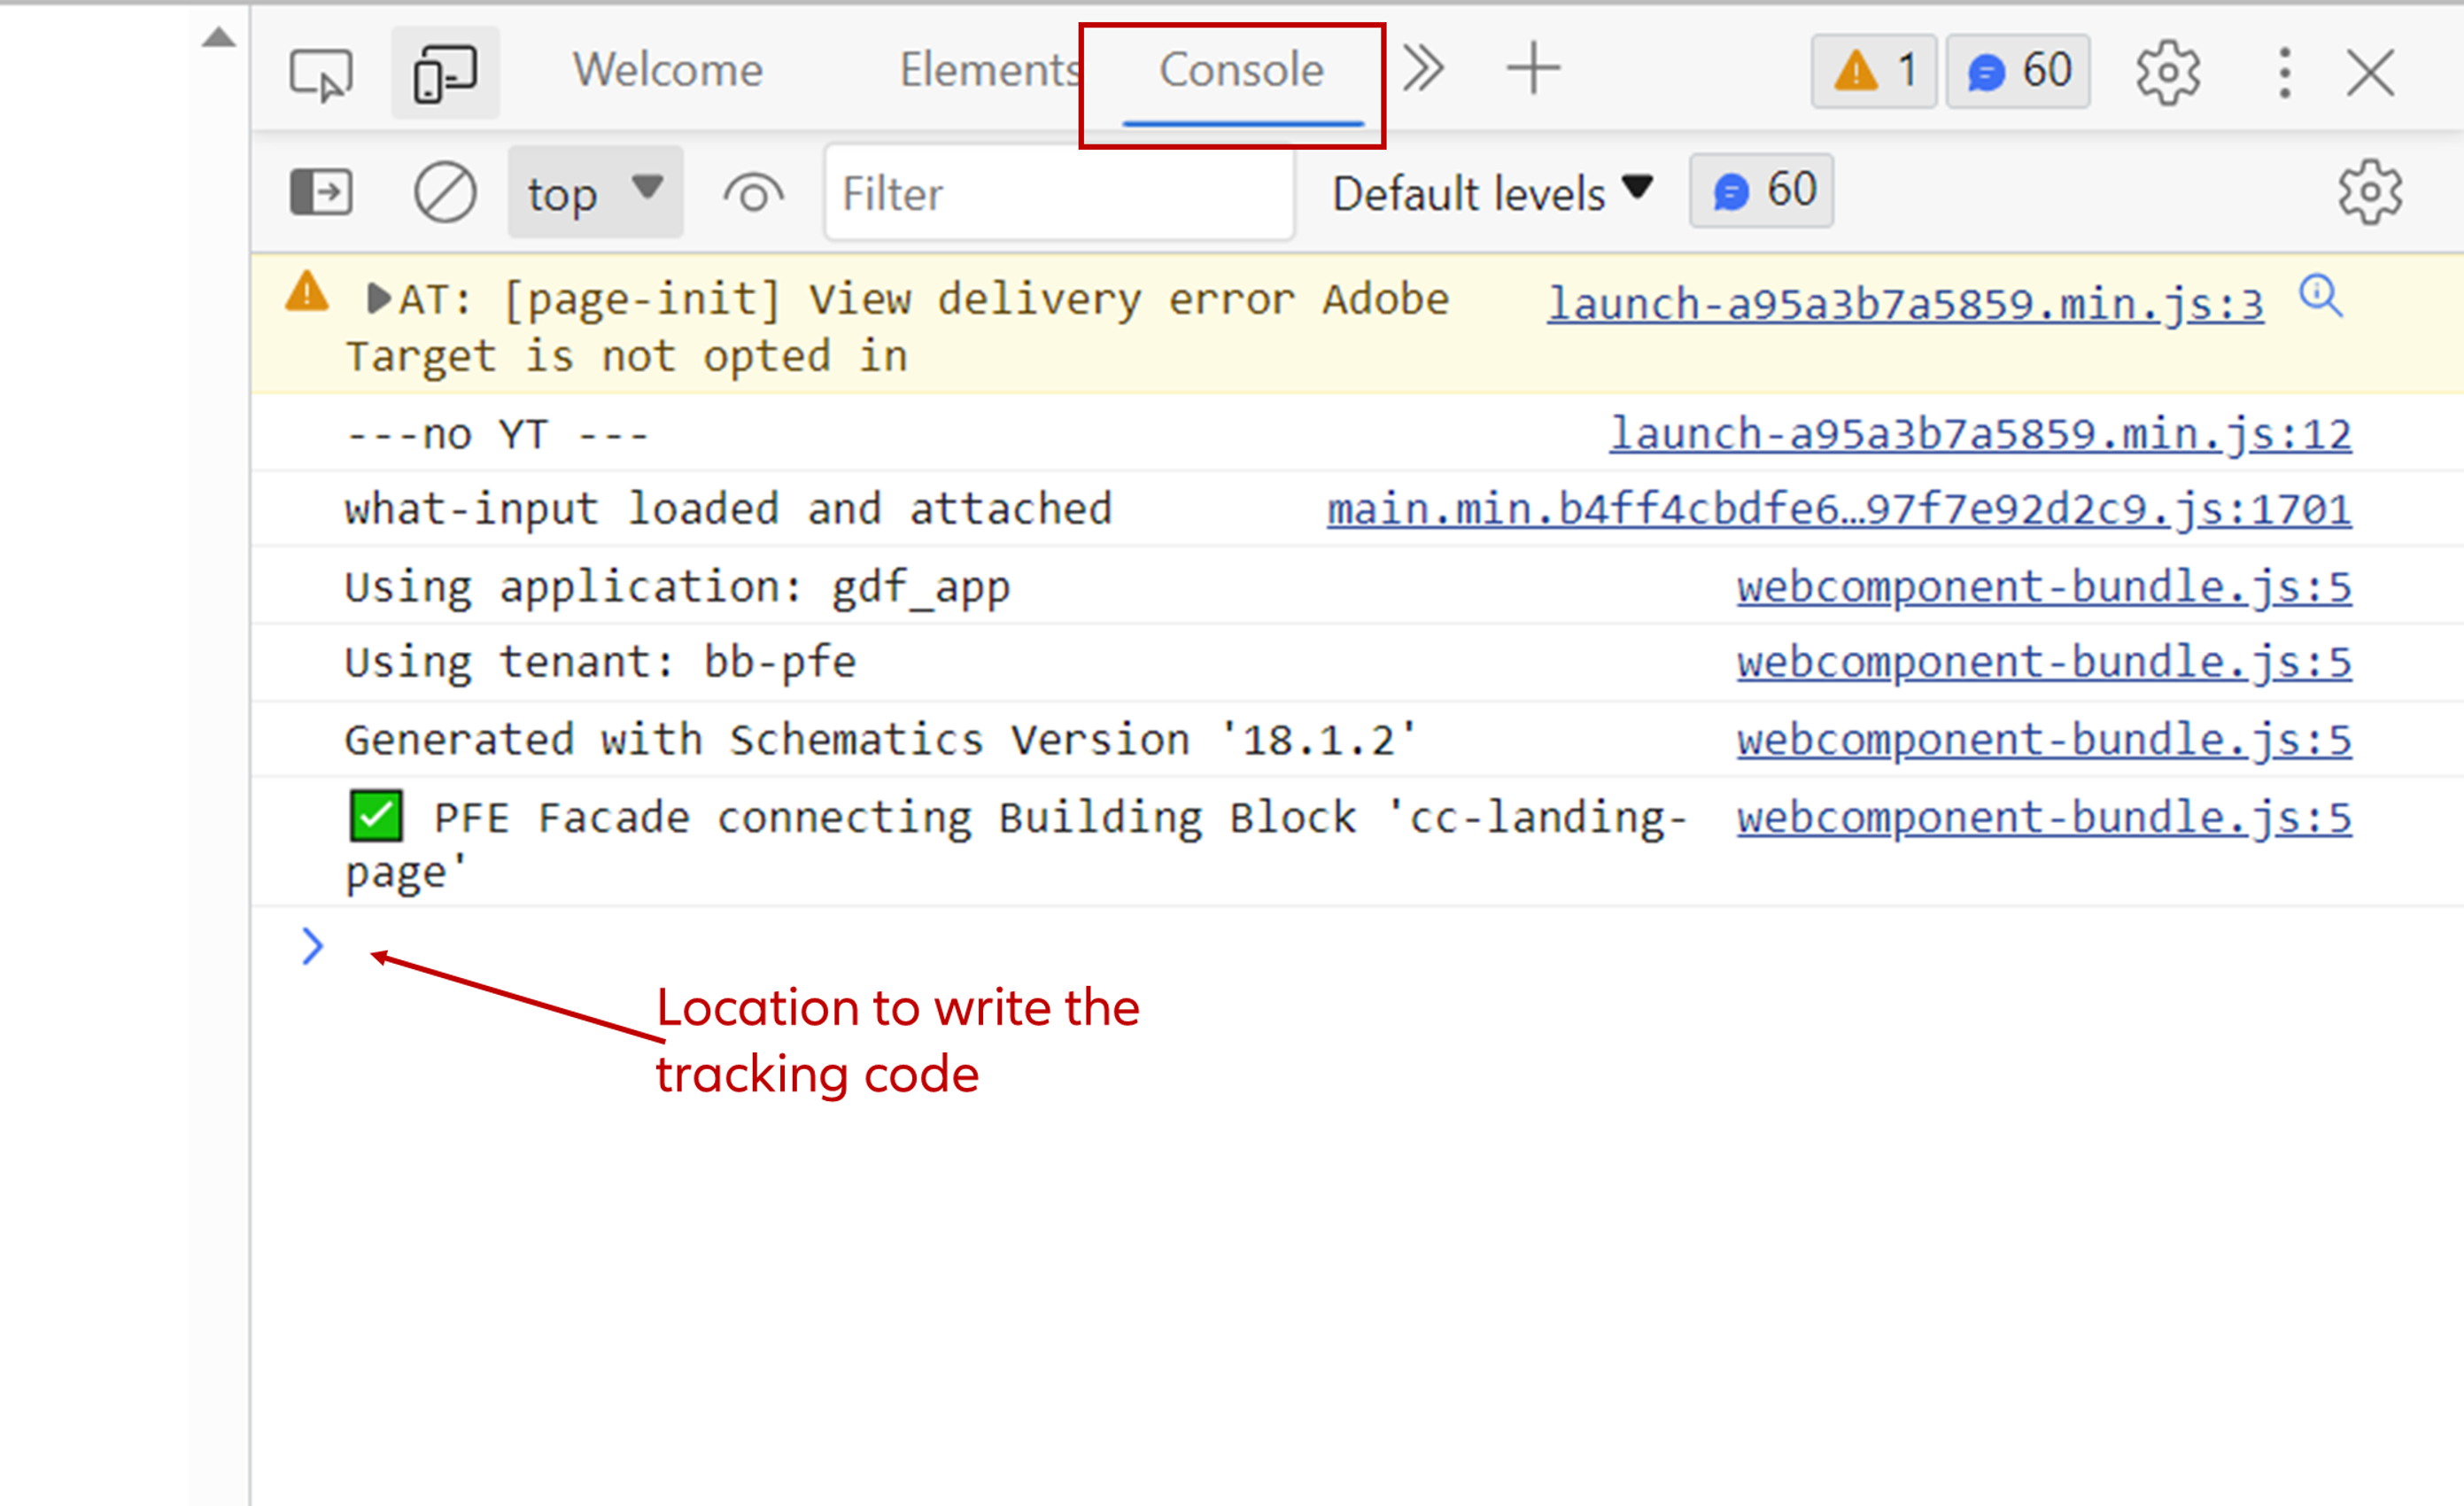
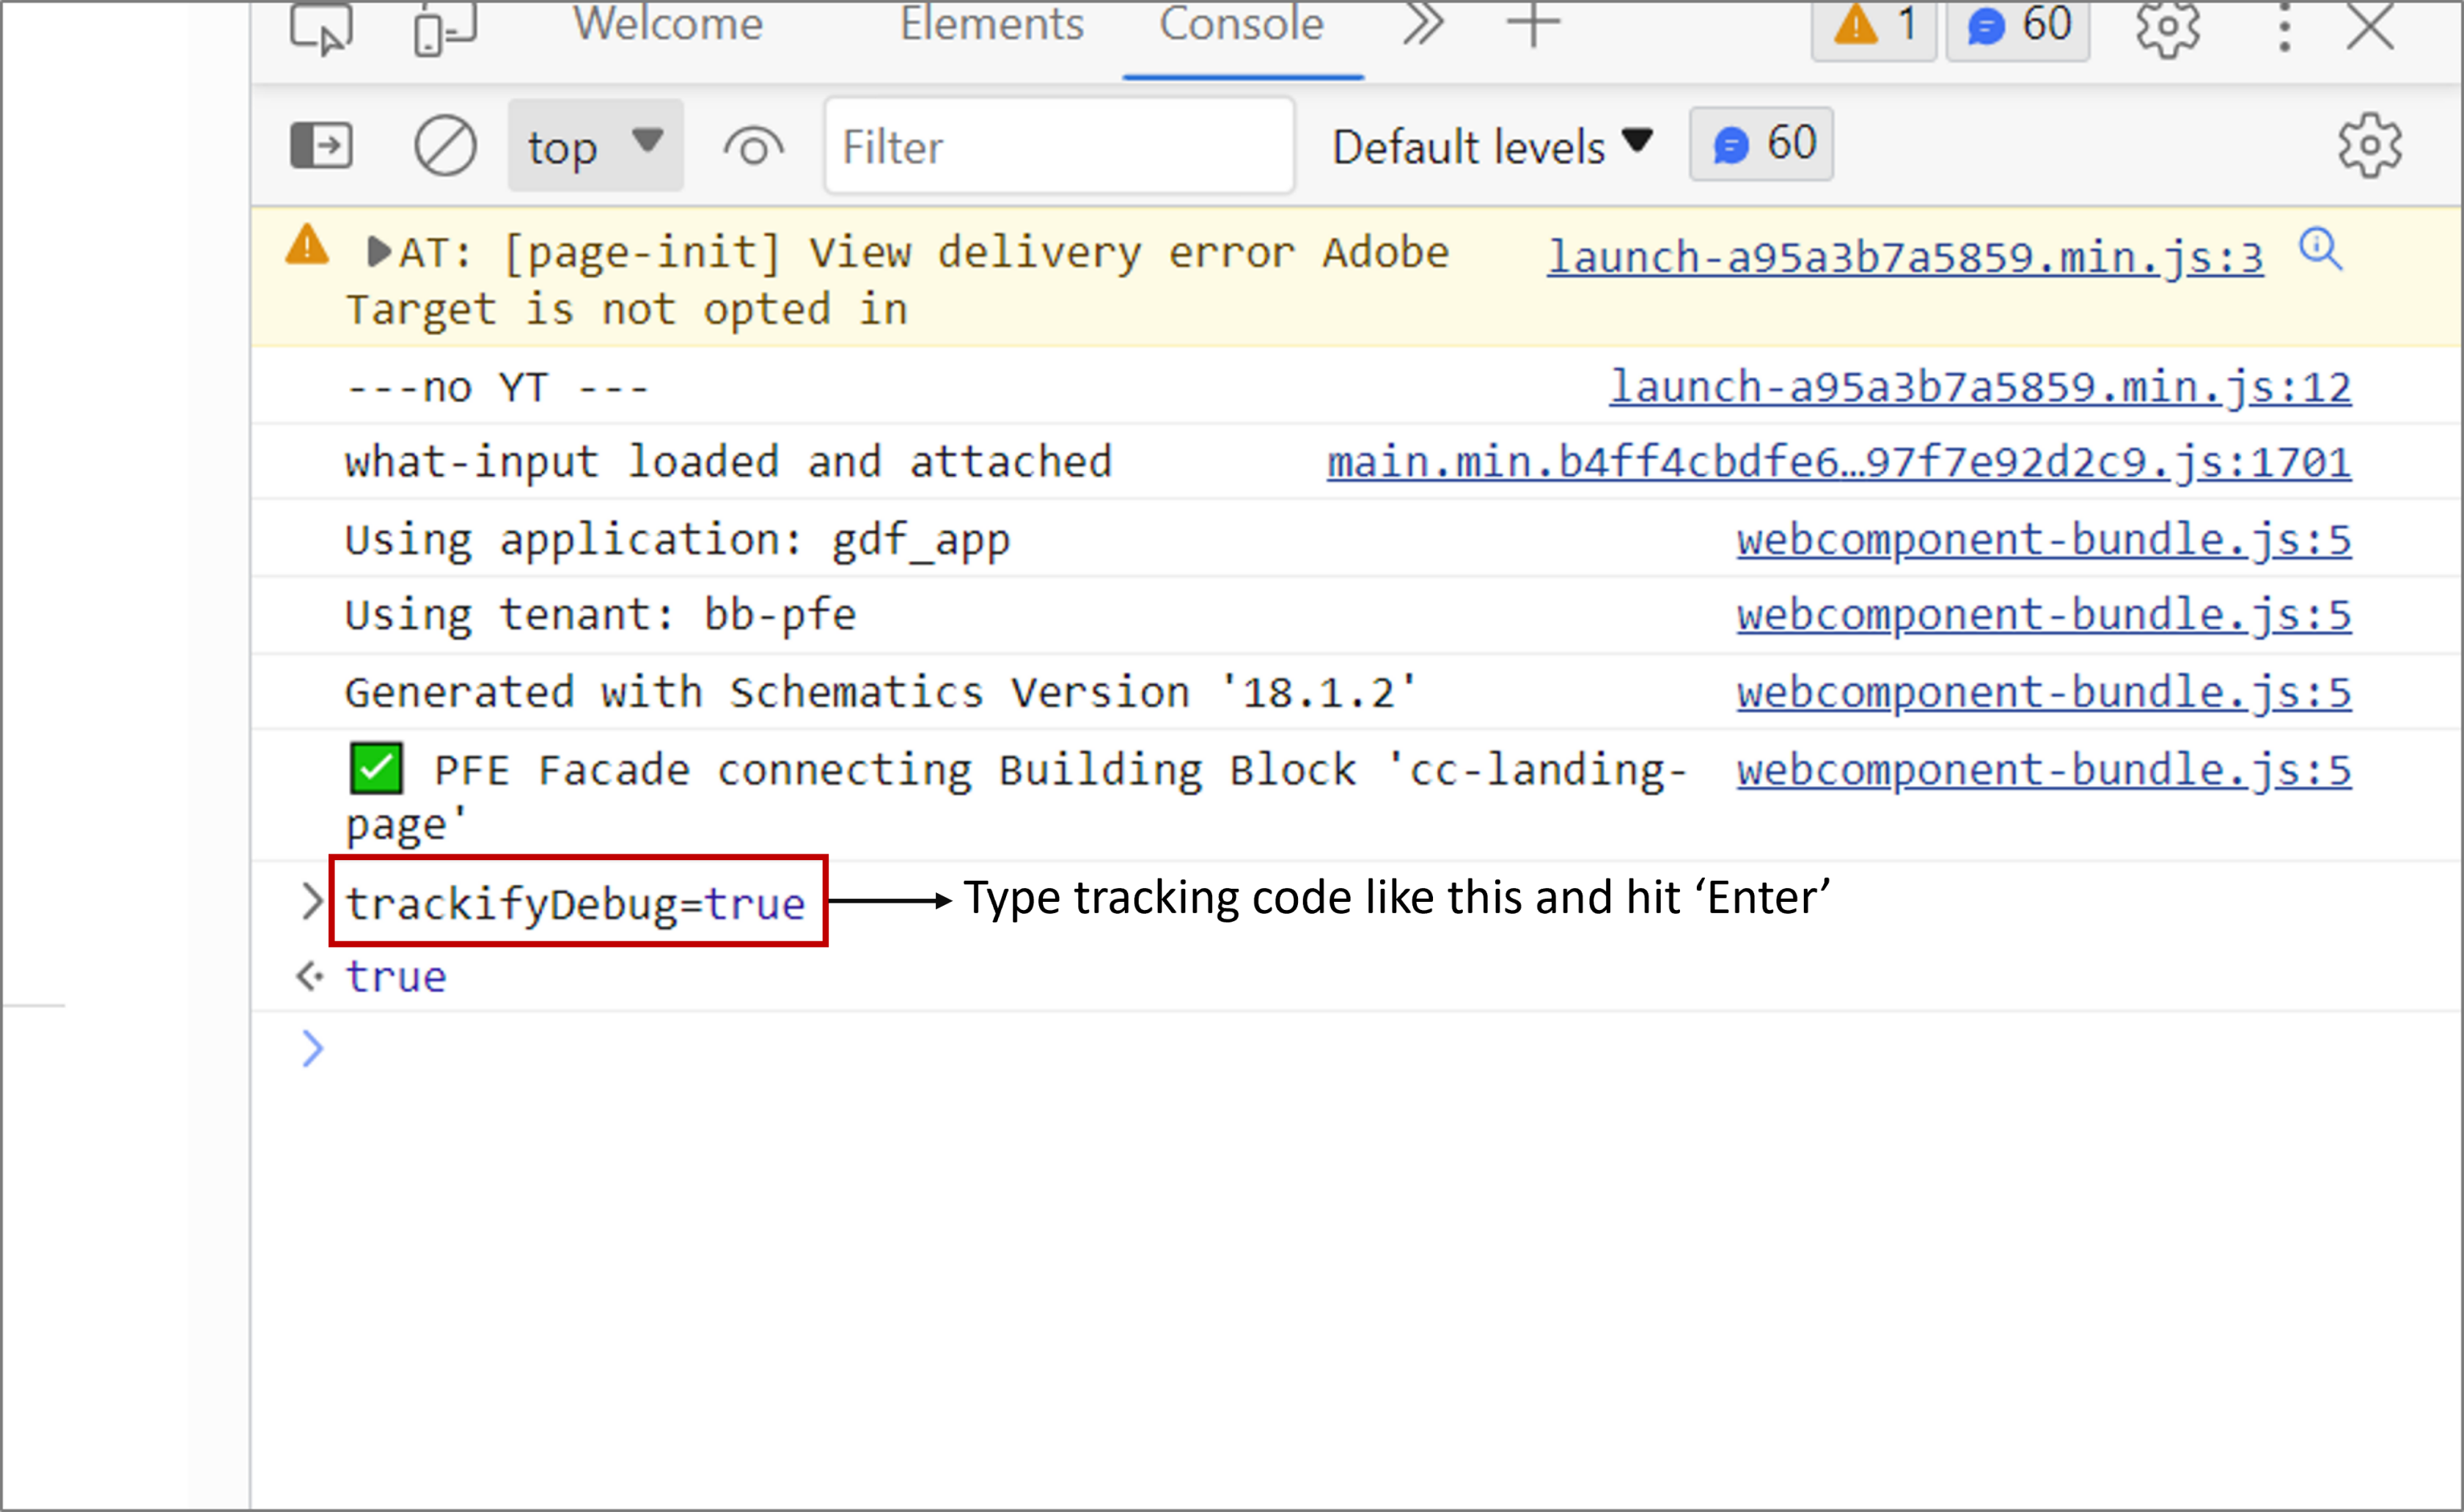
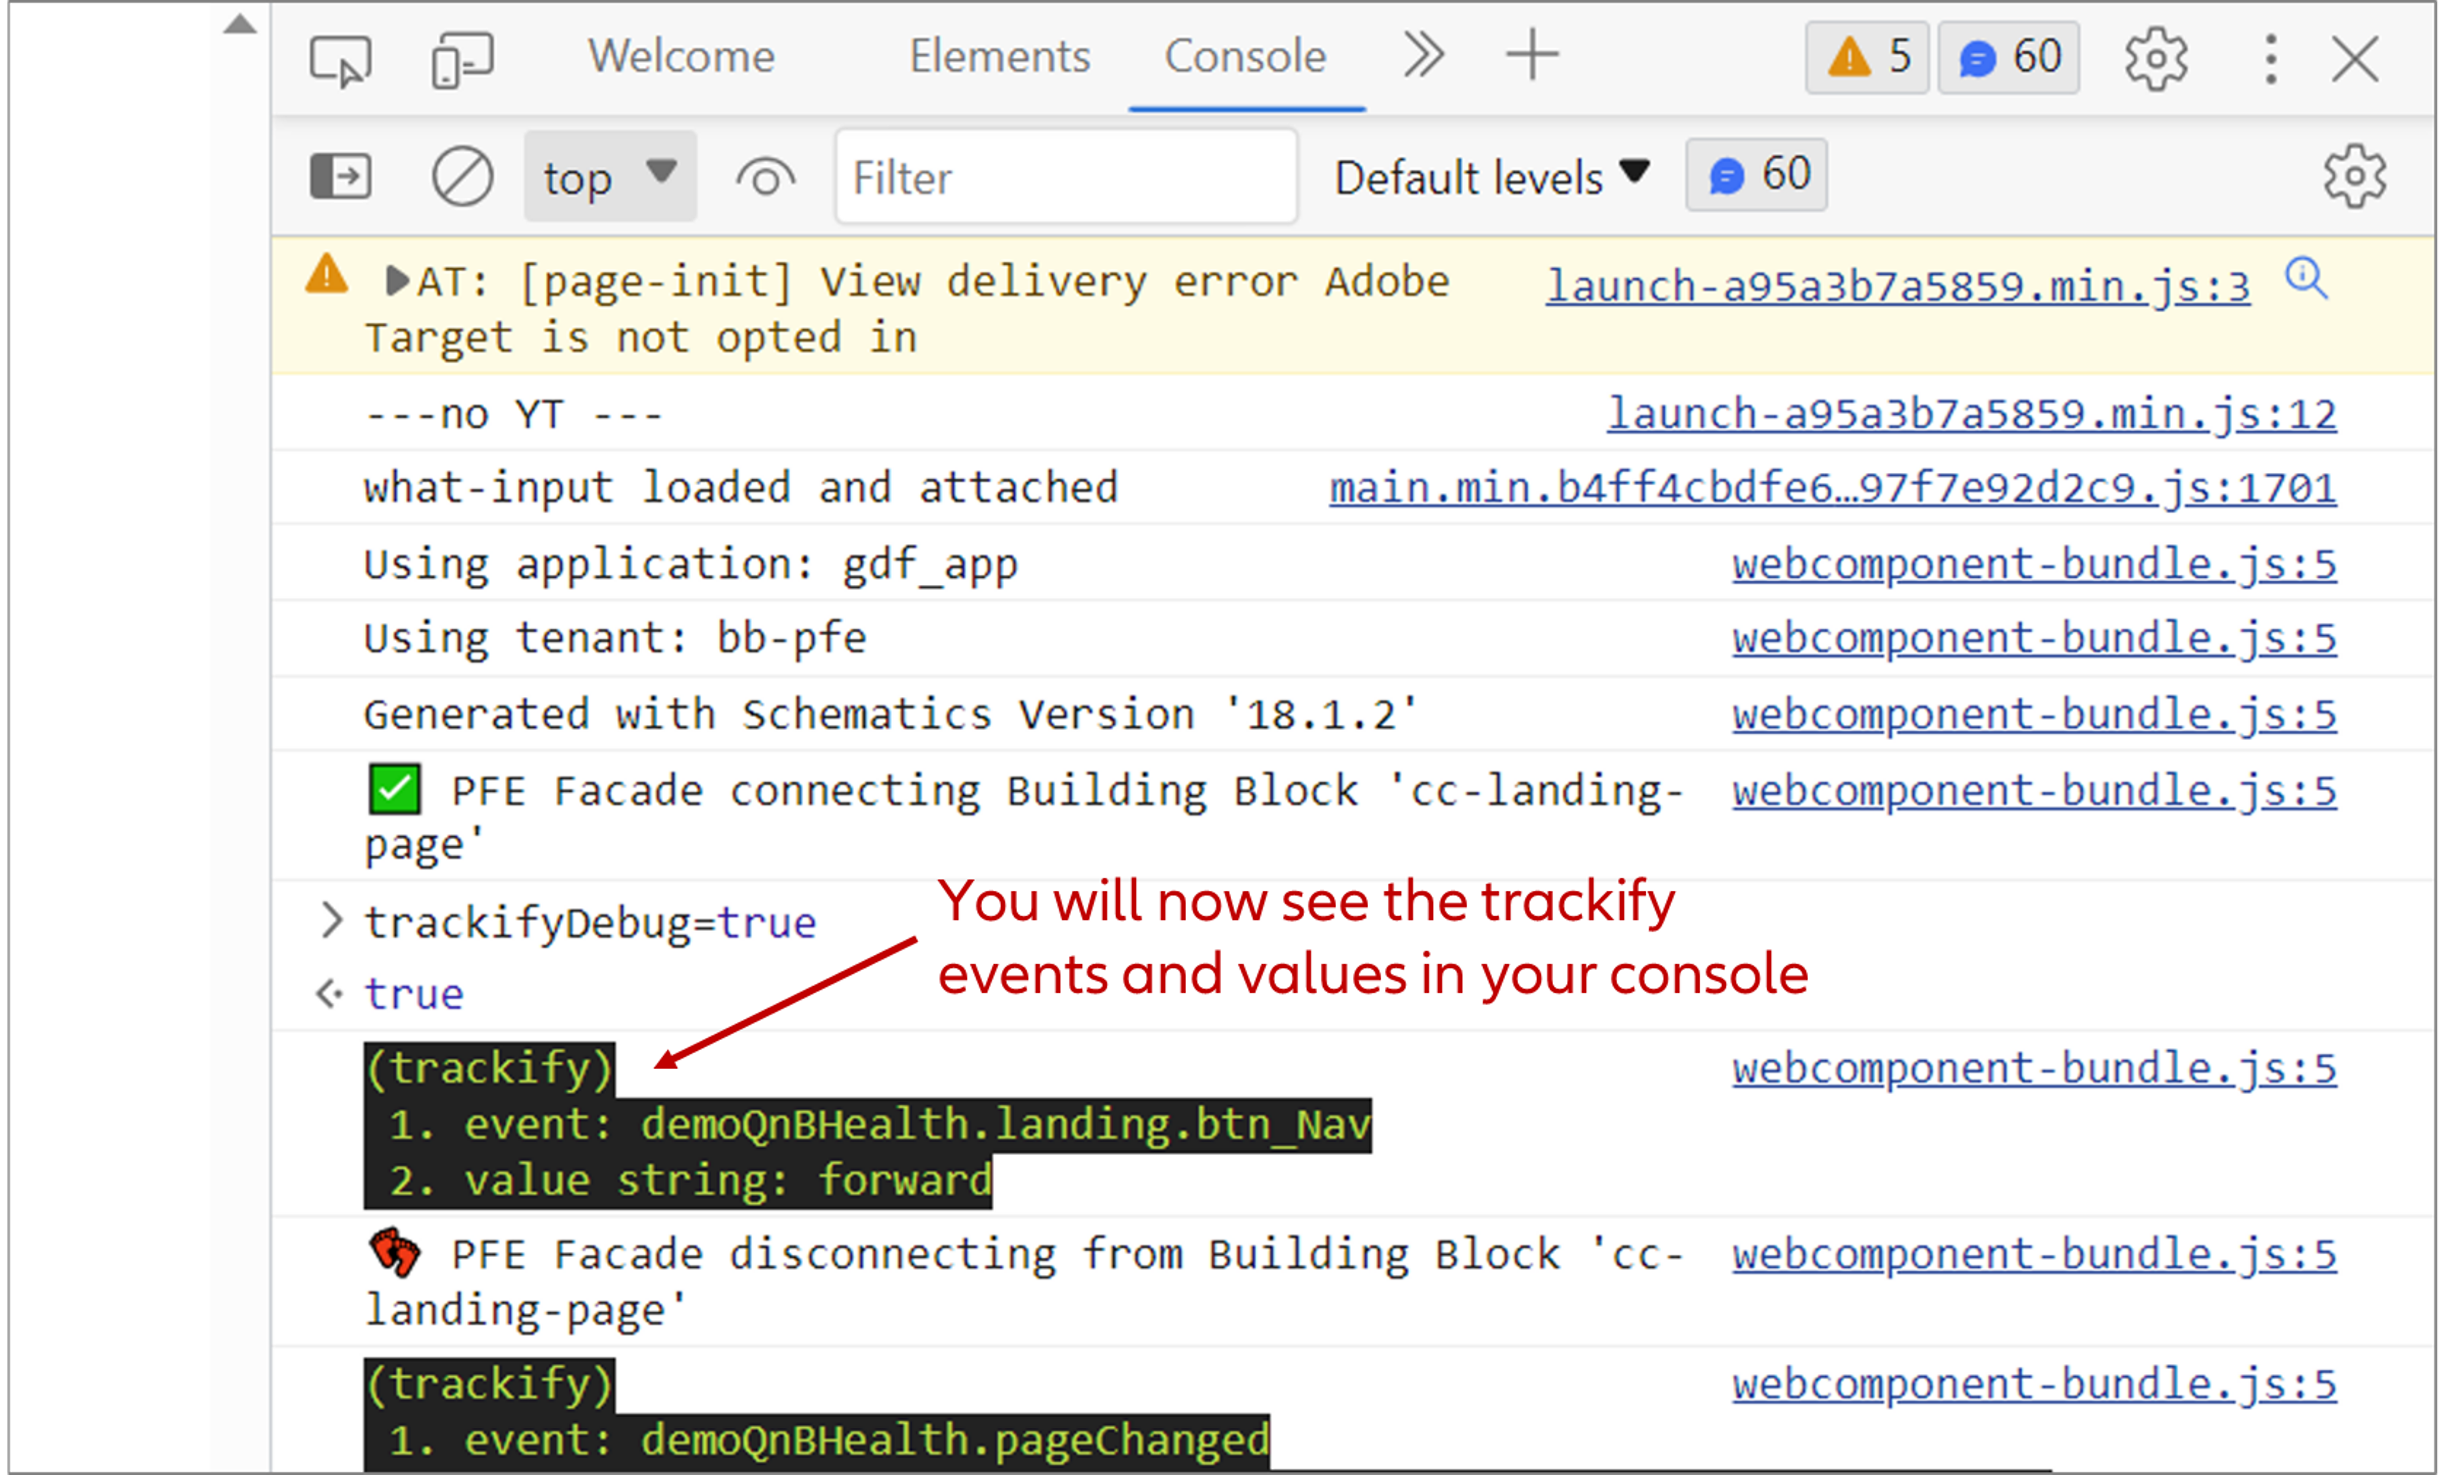
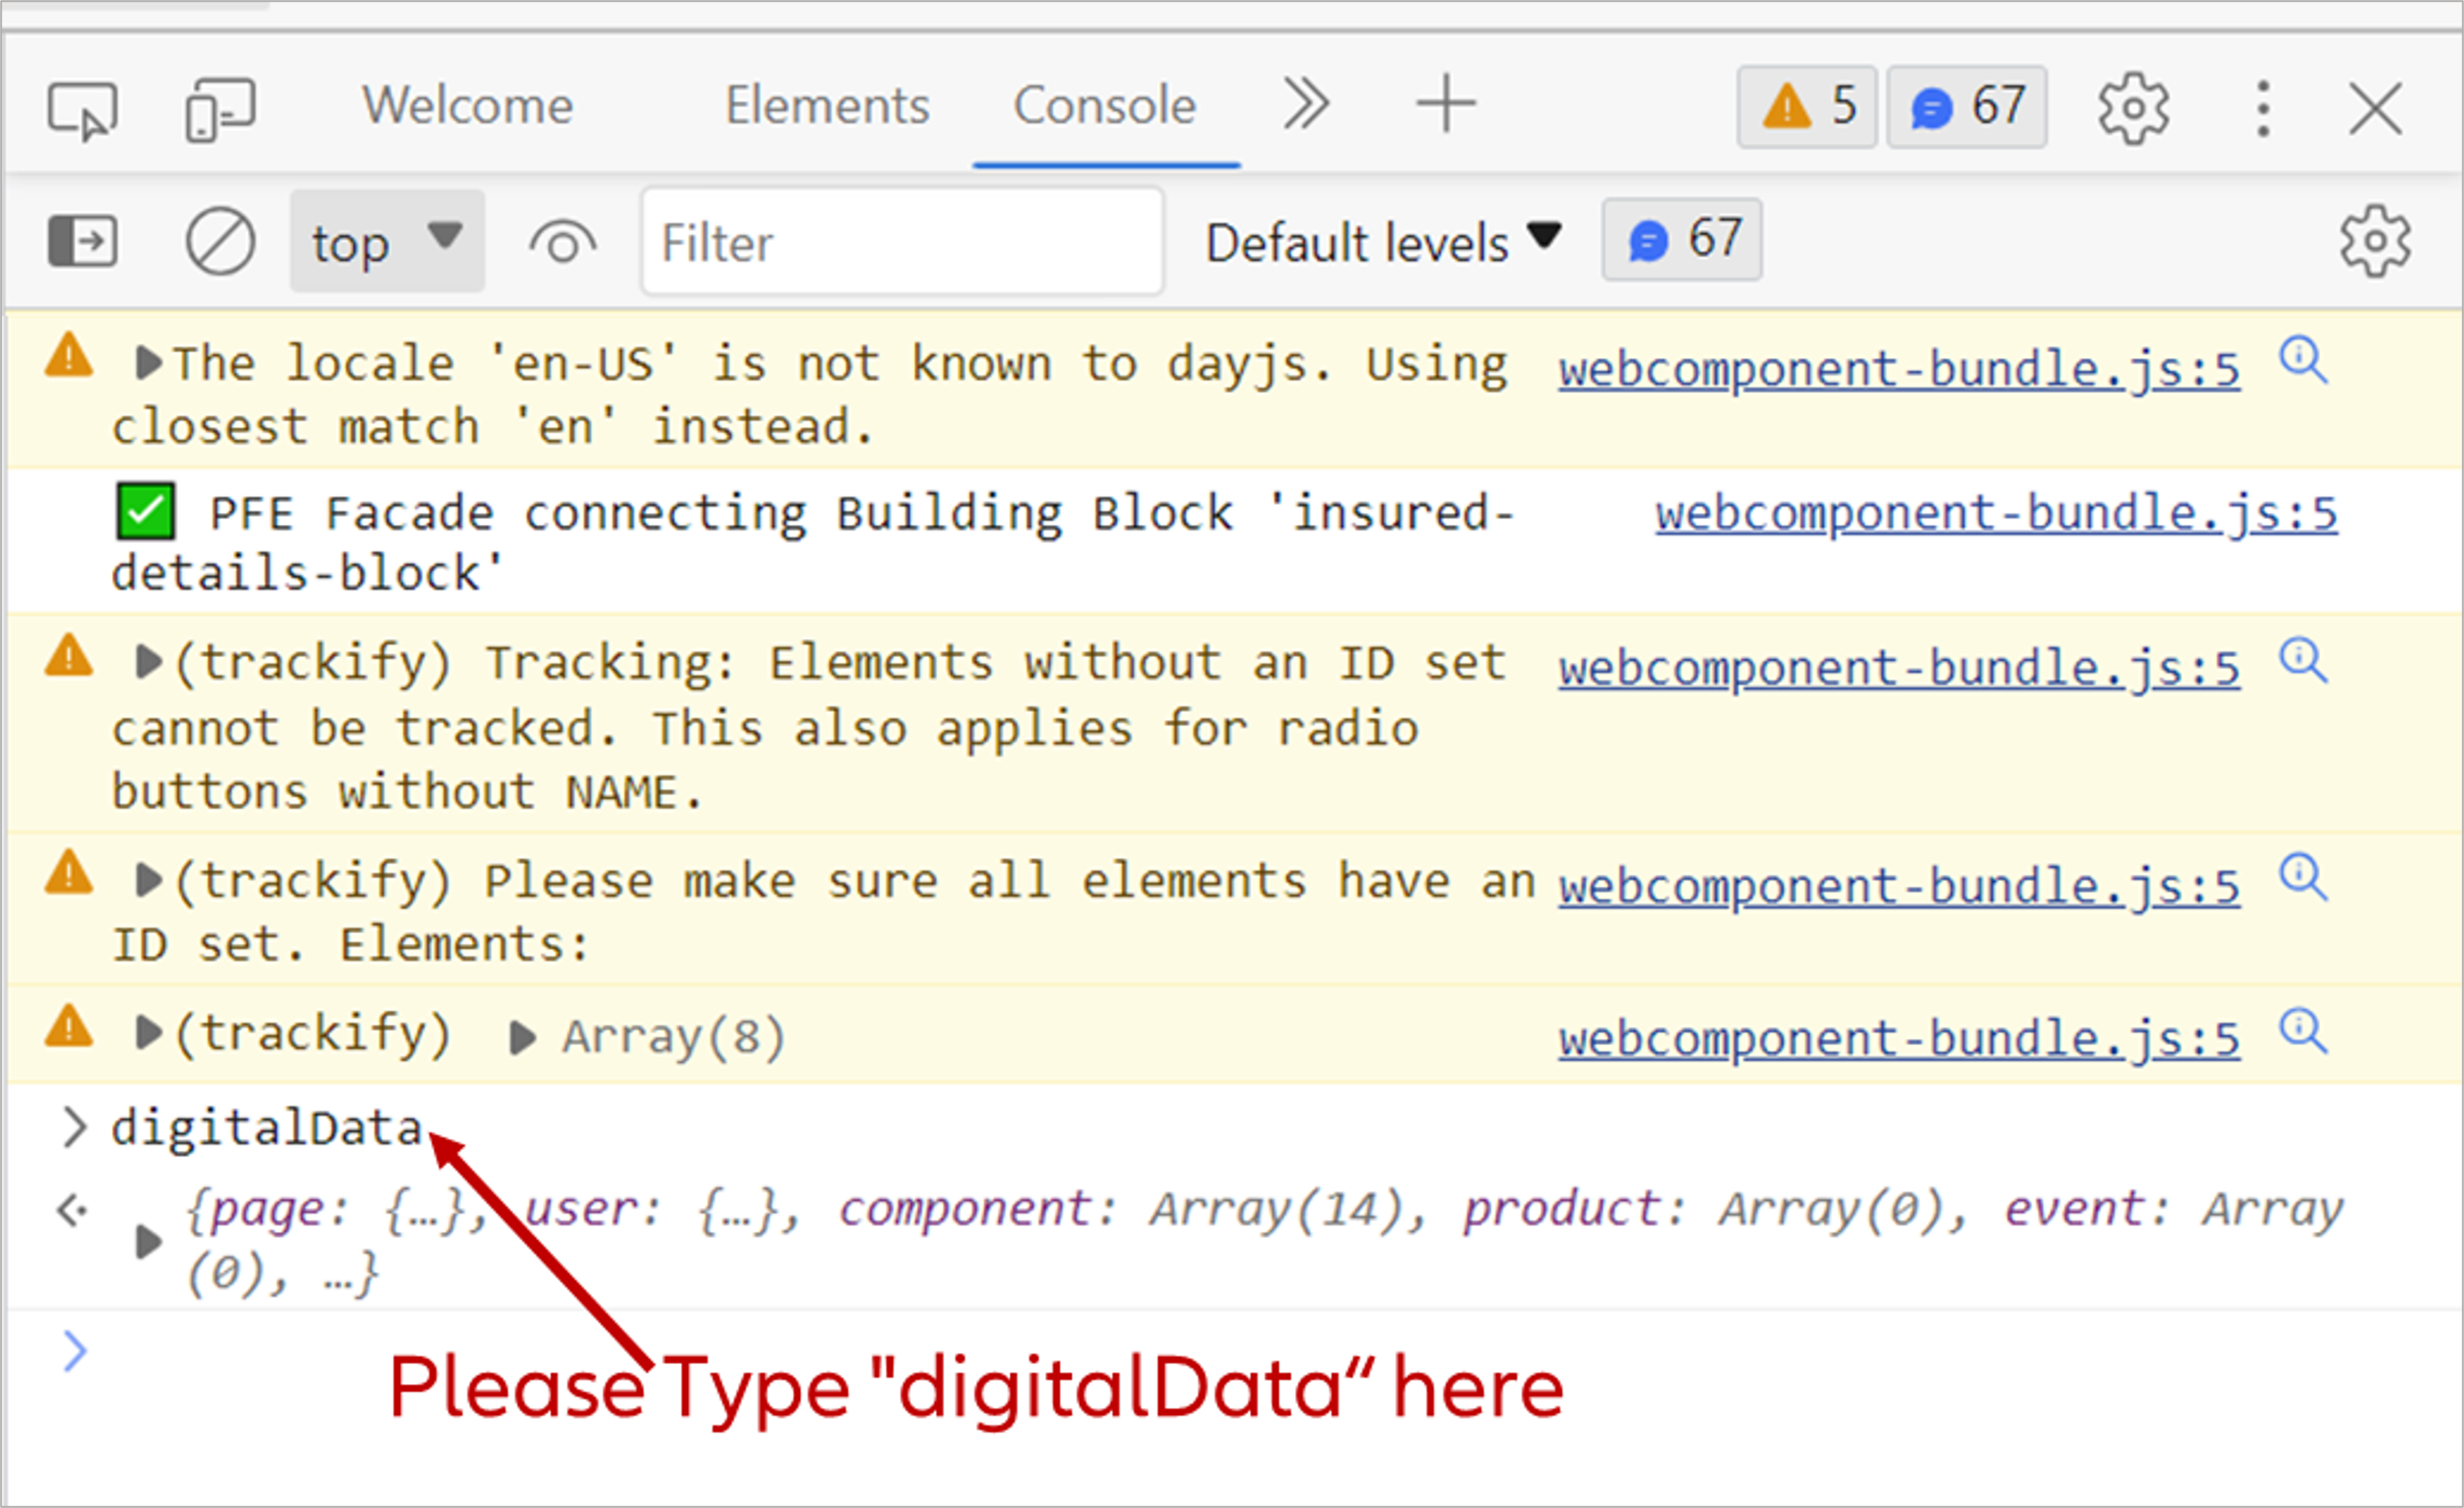
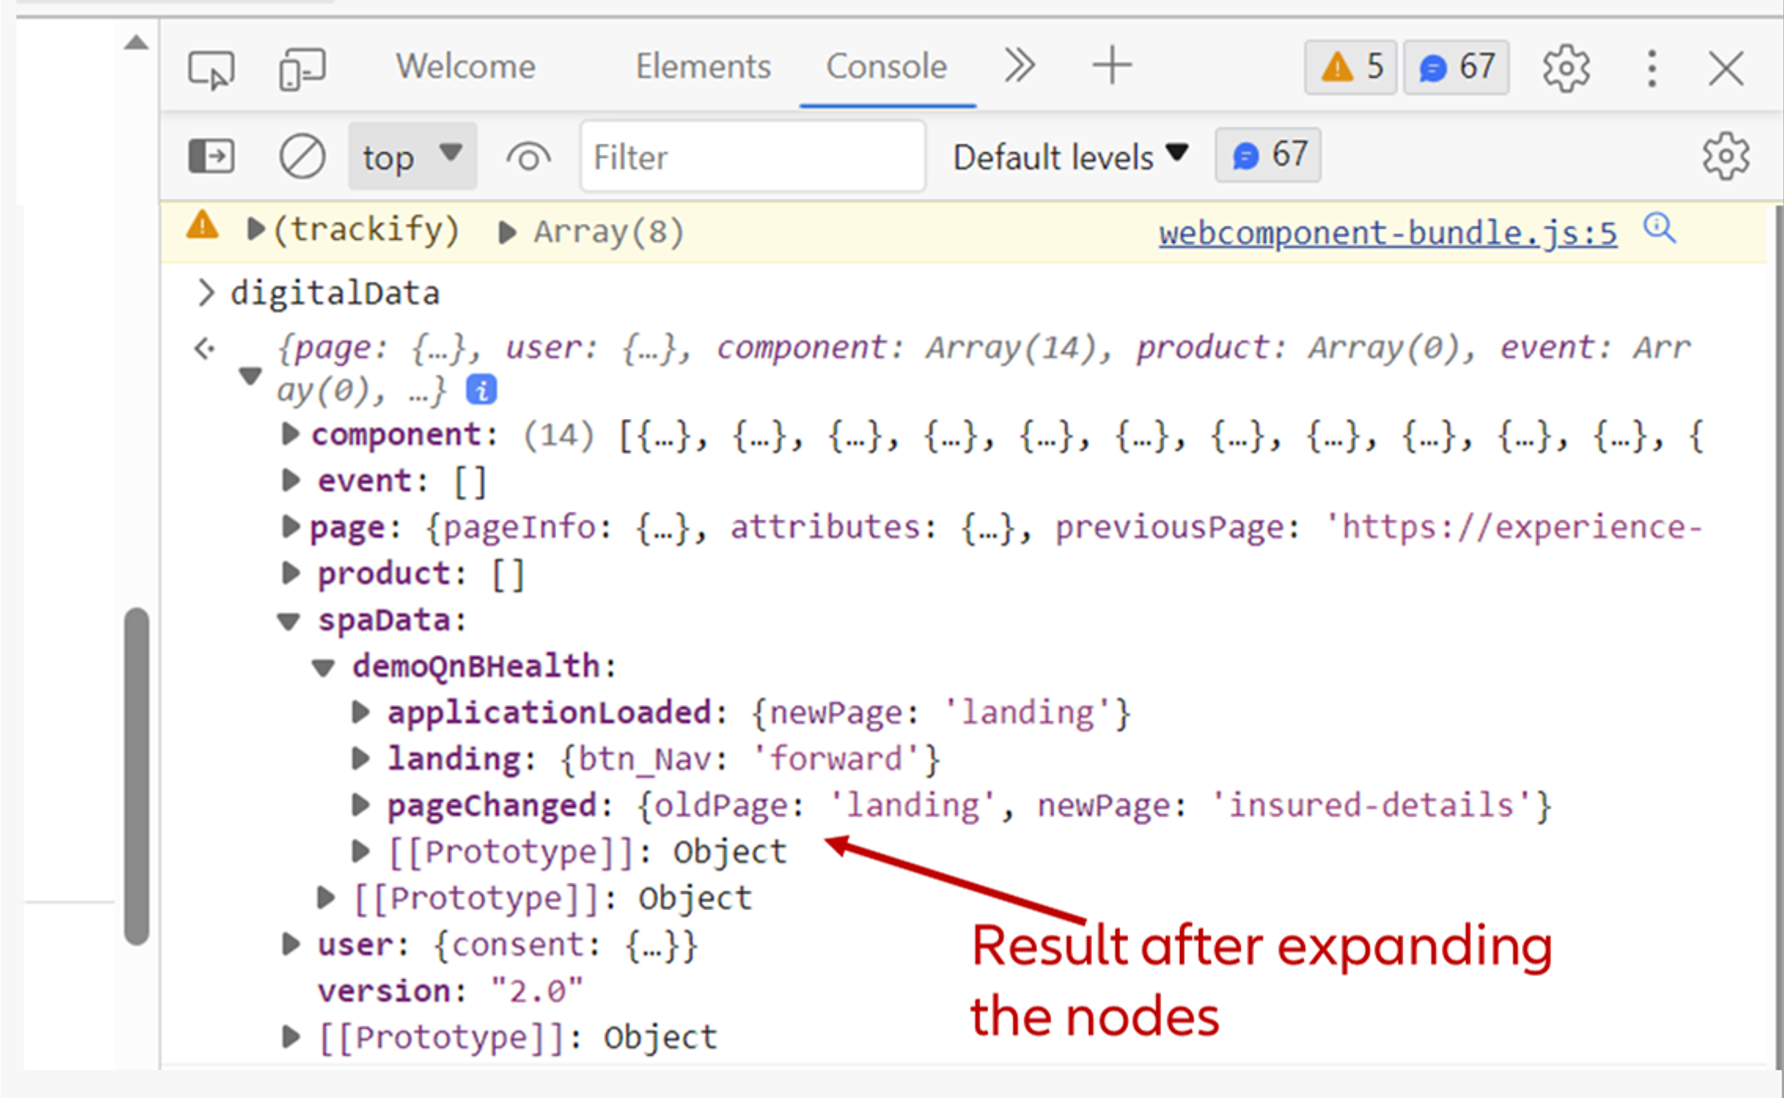
And after that, we want to give you the opportunity to get a better sense of how the tracking is implemented: Just click through the journey below with the instructions given, and you will get a look under the hood of the DAS.

We have defined six Core KPIs. All of them are meaningful across journeys, intuitive, and across the six, they paint a good overview of the user interaction with an asset.
 
Visits: How many times has this asset been visited?
 
Visitors: How many different users have visited the asset during a certain time frame?

Bounce rate: What is the percentage of visits where the user saw only one screen and did not take any relevant action there?
Core KPIs 1

Conversion Rate: What percentage of the users who start a journey successfully complete it?

Time for conversion: How long does it take on average to complete the journey?

Ending on error: What percentage of users can't finish the journey because they are stuck with an error message?

Core KPIs 2

For each of the six core KPIs, we also have a graphic with additional information. In the case of "unique visitor", this is a timeline of how the number of unique visitors has developed over the last 30 days.
KPI 1 - additional details

The conversion funnel gives deeper insights into the conversion rate: At which steps along the journey do we lose the most users?
conversion funnel

The conversion funnel comparison takes the idea of the conversion funnel one step further: Applying different filters to the same journey and comparing it side by side helps to identify influencing factors of user churn.

For example, this allows you to compare side by side where first-time visitors typically drop out in your Health Quote and Buy journey, versus users that are on a return visit.

conversion funnel comparison

In addition to the six Core KPIs, the level one dashboard contains some further metrics. This part for example is about retaining users and making them return to the journey after their initial visit.
Additional Info retention

Are you interested how the technology behind the Digital Analytics System works? This demo will give you a sense how data is collected in the DAS, and what role trackify (our tracking library) and digitalData (the data layer) play in the data collection process.
01. To open your developer console, simply click the right button in your mouse and then select the inspect option from your browser. You can also go there by clicking on ctrl + shift +i in Windows and  Option +  ⌘  +C in MAC.
02. You should now see different tab buttons there such as welcome, elements, console etc. Please go to the "console" tab.                                                                                                                                                                                              
03. Perfect! Then type "trackifyDebug=true'' under the console tab and hit the Enter button. Please check the screenshot below to know where exactly you should paste the code.
04. Awesome! Now go to the Demo section at the bottom of this page and start interacting with the journey, e.g. by hitting the ''Next'' or ''Contact Us'' button from the journey. 
05. Interested in what is written into the datalayer? Type "digitalData" in your console, and hit the Enter button again.
06. You will now see the datalayer. You can expand the nodes by clicking on the little arrow symbols