Adobe Analytics Insights Generation

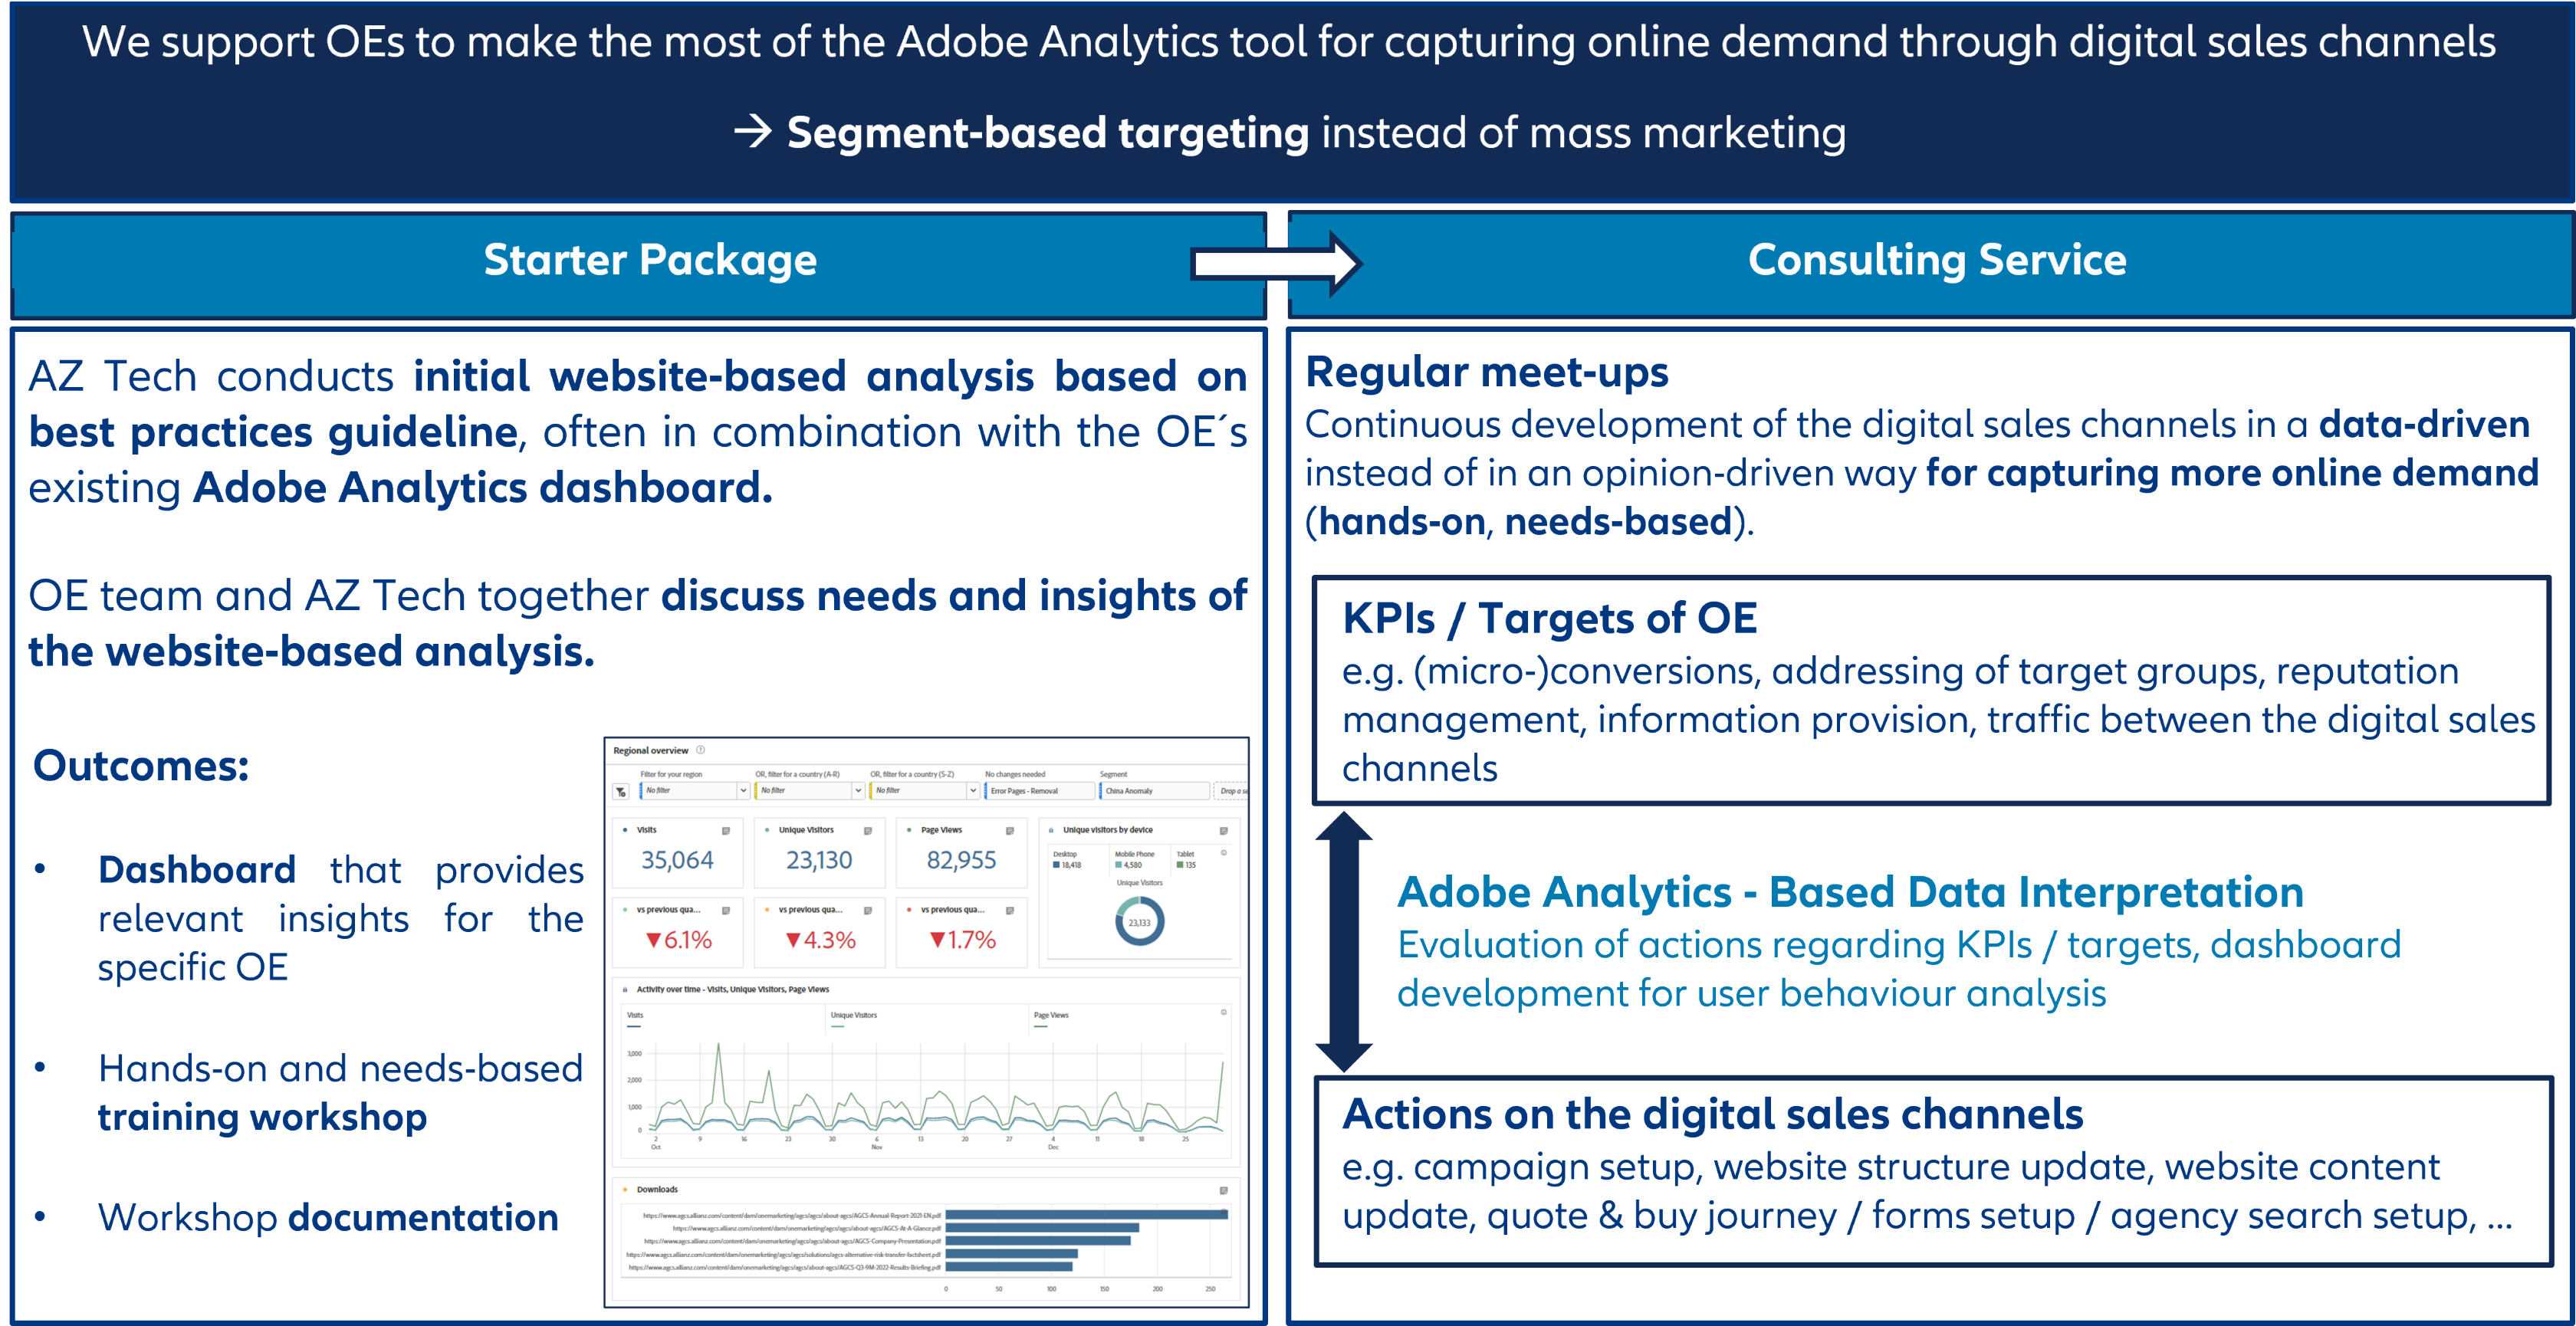
The additional service supports OEs in increasing online demand capture through their digital sales channels, which is critical for acquiring new customers, increasing X-sell and reducing churn in the ROPO (Research Online Purchase Offline) business:

  • Idea: Implementation of segment-based targeting instead of mass marketing using the Adobe toolset.
    -> play off targeted marketing measures for different website visitor groups.
  • Examples: on-site personalization, offsite retargeting.
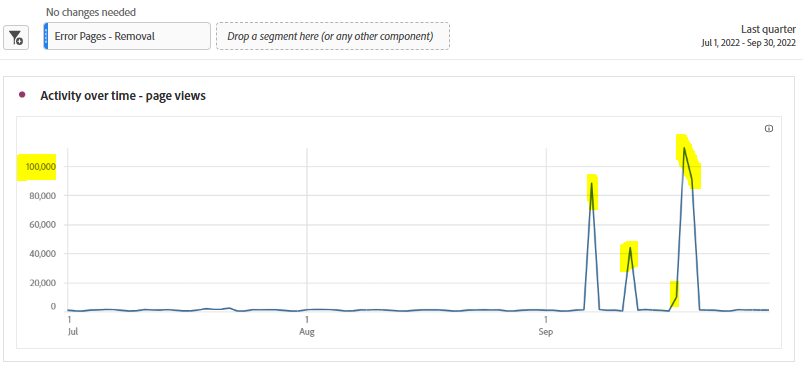
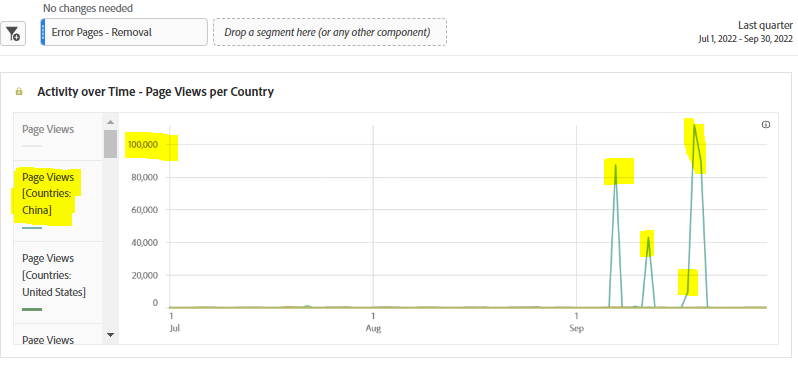
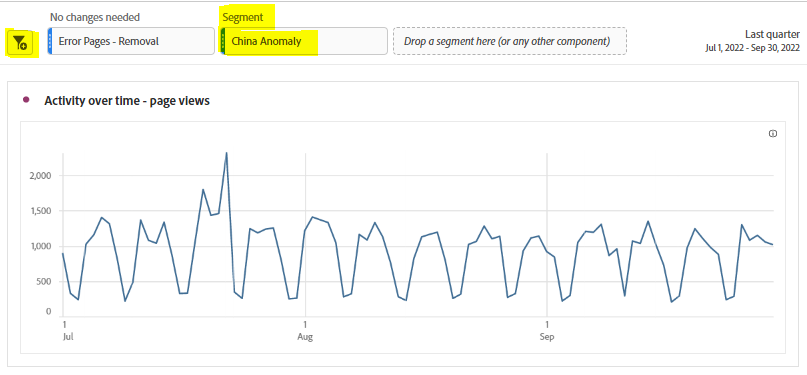
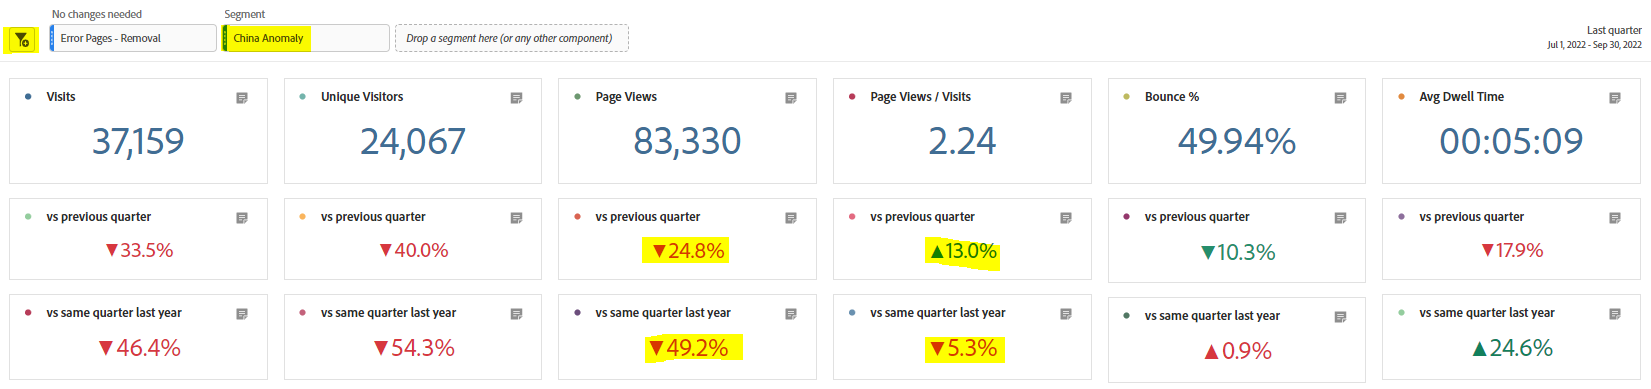
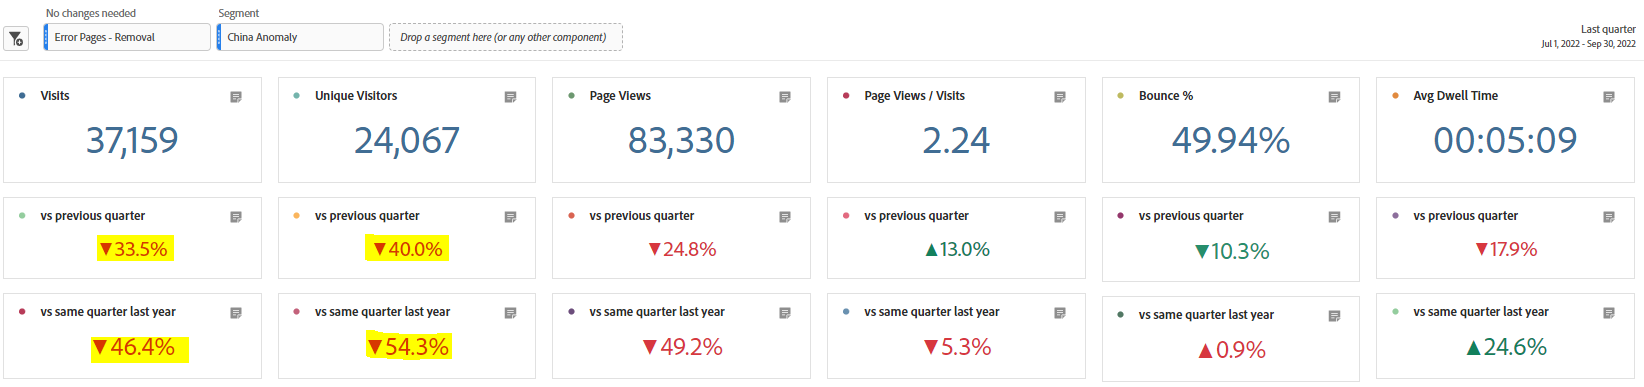
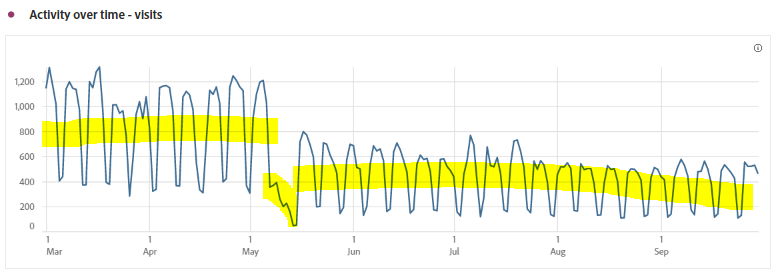
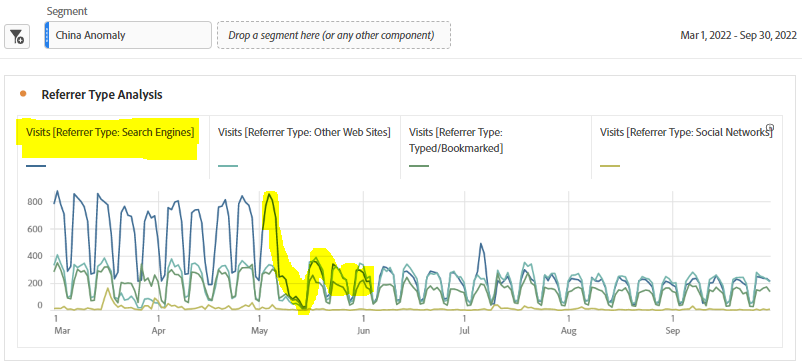
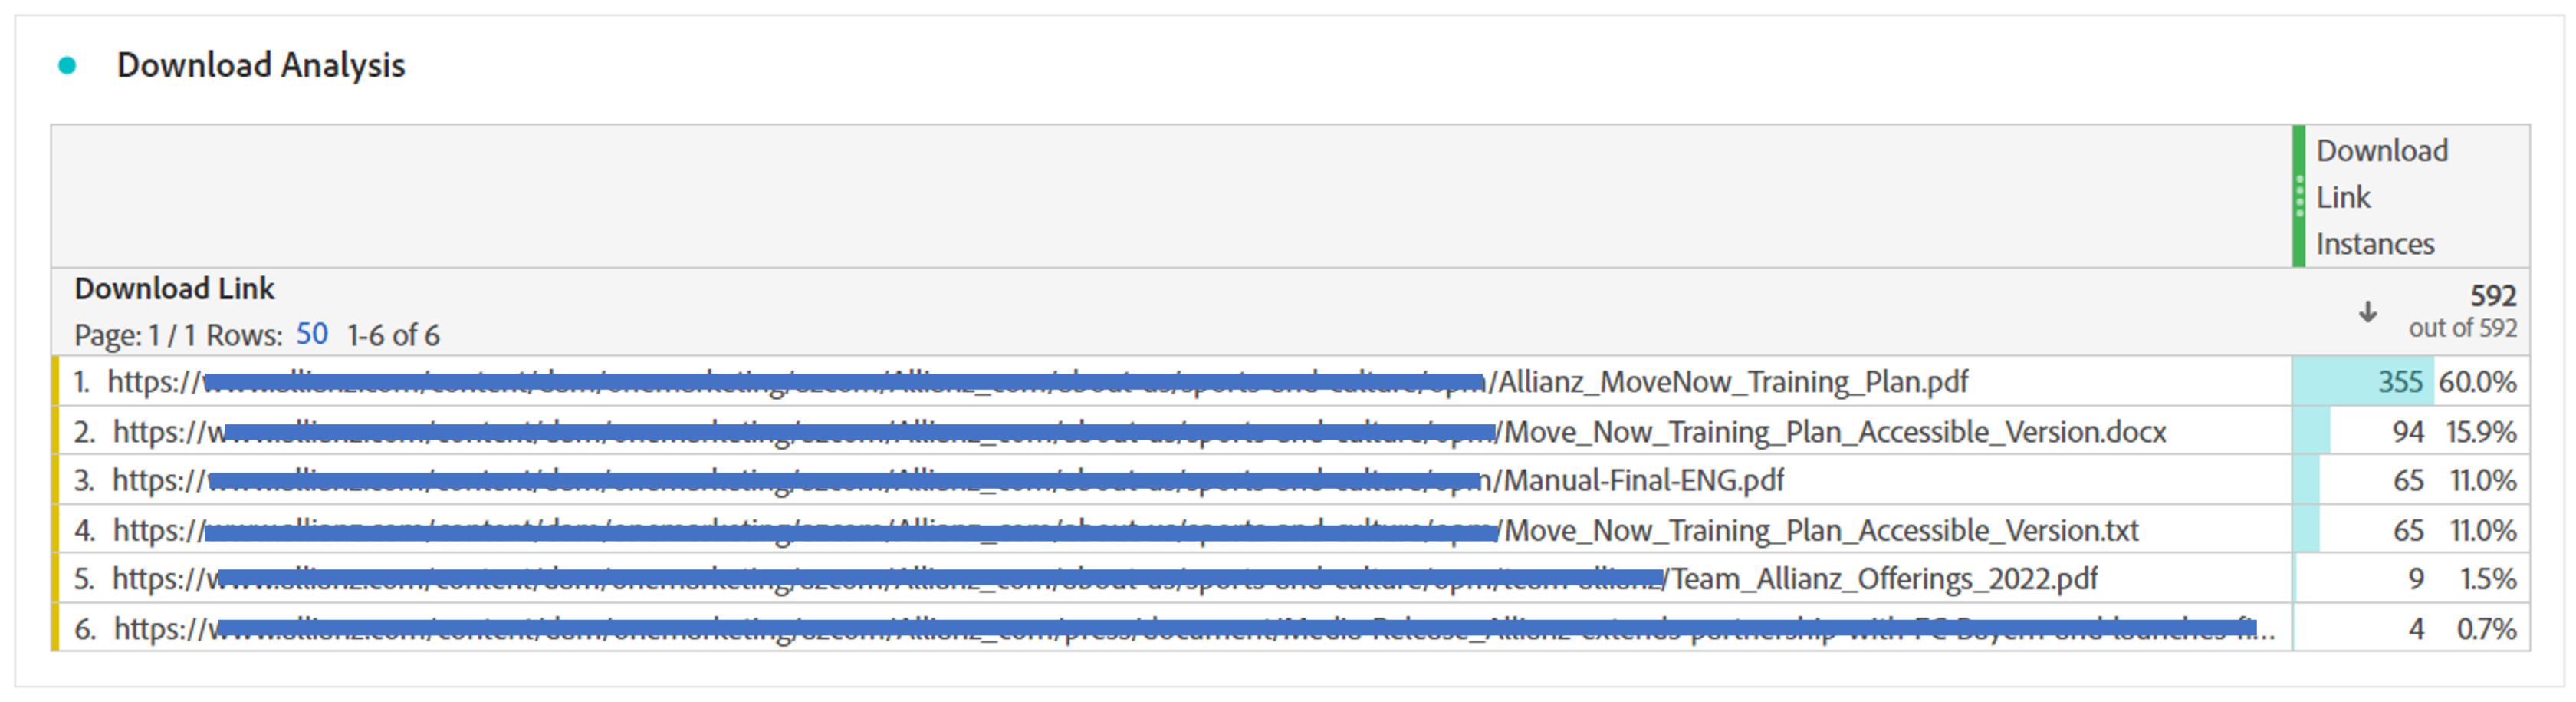
  • First Step: User behaviour analysis, i.e., to understand the website visitors´ characteristics, which relate to their behaviour on the website.
    -> Adobe Analytics offers the features for the required user behaviour analysis.
  • Subsequent Steps: Segmentation of website visitors based on their characteristics using Audience Manager; Development and implementation of targeted marketing measures per segment using Adobe Target.

If you want to learn more about the additional service, reach out to the ECS team. The contact details can be found below on this page.

Learn more about possible use cases in the use case section below.

AA_Service_Concept
Use Cases
In the use case section we continuously give you insights into use cases from OEs regarding user behaviour analysis using Adobe Analytics. You will recognize the value of the additional service "Adobe Analytics Insights Generation" for the work with data in the Adobe Analytics tool.
 
KPI analysis
 
As you can see in the subsequent figure, for a certain website, KPIs such as visits, unique visitors, page views, page views/visit, bounce rate or average dwell time, are summarized in an Adobe Analytics panel for the last quarter (here: Q3/2022). To be able to assess the KPIs´ values better, the numbers of the last quarter are compared to the numbers of the quarter before (here: Q2/2022, second row) and to the numbers of the same quarter of the year before (here: Q3/2021, third row). 
 
The increase in the number of page views and page views/visits in Q3/2022 compared to Q2/2022 and Q3/2021 is extraordinary high (marked in yellow), especially compared to the decrease in the number of visits, unique visitors and average dwell time. Therefore the number of page views and page views/visits should be analyzed in more detail.
 
Insights_generation_main_kpis_page_views
 
One option for a more detailed analysis of the number of page views in Q3/2022 is the analysis of the number of page views over time on a daily basis. In the subsequent line graph you can see that there is no overall extraordinary high level of the number of page views, but that the comparatively high number of page views results from an extraordinary increase in the number of page views on specific dates, i.e. 7th, 12th, 18th, 19th and 20th of September (marked in yellow). 
 
Insights_generation_main_kpis_page_views_line
 
As illustrated in the subsequent line graph, the country specific analysis of the development of page views over time on a daily basis shows that the extraordinary increase of page views on 7th, 12th, 18th, 19th and 20th of September can be assigned to China as country of origin.
 
Insights_generation_main_kpis_page_views_line_countries


How can you make use of the analysis results regarding anomalies?

The issue is that all KPIs of Q3/2022 in the overall KPI overview are skewed by the anomalies. As a consequence, the KPIs cannot be used as basis for an analysis of actual user behaviour. To overcome this issue, a segment can be created, e.g. called "China Anomaly", which is used as a filter for the overall KPI overview panel. Because we know from the analysis before that the anomalies are assigned to the country of origin "China" and that they appeared on 07th, 12th, 18th, 19th and 20th of September 2022, we can exclude all hits from the segment that meet these criteria. 

The subsequent line graph shows the development of the number of page views in Q3/2022 on a daily basis after filtering by the "China Anomaly" segment. You can see that there actually were page views in Q3/2022, unlike it seemed to be the case in the line graph before filtering by the "China Anomaly" segment.

Insights_generation_main_kpis_page_views_no_anomalies
 
By filtering by the "China Anomaly" segment, you can use the overall KPI dashboard for analysing user behaviour on your website despite the anomalies in the original data. You can see now, for example, that actually the number of page views in Q3/2022 decreased compared to Q2/2022 and Q3/2021.
 
Insights_generation_main_kpis_no_anomaly
 
If you find the root cause for the anomaly, you should try to fix it for the future. In the underlying use case, the reason for the extraordinary increase in the number of page views on specific dates are most probably bot activities that are not filtered out by Adobe Analytics automatically. The filters for specific user behaviour tracked on the website can be refined in Adobe Analytics configurations.


KPI Analysis

As you can see in the subsequent figure, for a certain website, KPIs such as visits, unique visitors, page views, page views/visit, bounce rate or average dwell time, are summarized in an Adobe Analytics panel for the last quarter (here: Q3/2022). To be able to assess the KPIs´ values better, the numbers of the last quarter are compared to the numbers of the quarter before (here: Q2/2022, second row) and to the numbers of the same quarter of the year before (here: Q3/2021, third row). 

The decrease in the number of visits and unique visitors in Q3/2022 compared to Q2/2022 and Q3/2021 is extraordinary high (marked in yellow). Therefore the number of visits and unique visitors should be analyzed in more detail.

Insights_generation_main_kpis


One option for a more detailed analysis of the number of visits in Q3/2022 compared to Q2/2022 is the analysis of the number of visits over time on a daily basis. In the subsequent line graph you can see that the number of visits dropped in May 2022 and then continuously remained at a lower level as in the months before. We know from the OE that there was an tracking error in May 2022, which caused the immense drop in visits in May 2022. However, the constantly lower level of the number of visits after the dropping could not be explained by the tracking error.

Insights_generation_visit_analysis


Based on our experience, we know that there can be several reasons for a decrease in the number of visits. The most prominent reason are changes in the cookie policies based on GDPR, which result in a decrease in tracking of visits. Nevertheless, this could not be the main reason for a decrease of 33.5% in the number of visits in Q3/2022 compared to Q2/2022. So we searched for hints in the data what could have caused the continuously lower number of visits in Q3/2022 compared to Q2/2022.

The subsequent visualization shows the development of the number of visits over time on a daily basis depending of the referrer type. Since May 2022, you can see a decline in the number of visits with the referrer type "Search Engines", while the number of visits of the other referrer types remained on a similar level as before. The hereupon conducted research regarding search engine changes in May 2022 revealed that Google conducted a so-called "Core update" in the end of May 2022, where the search algorithm and systems were changed and which affected a website´s Google search ranking.


Insights_generation_referrer_type_analysis


How can you work with the analysis results?

In the underlying use case, we connected the OE to the SEO community, in which DIXD / AZ Tech colleagues discuss with several OEs, for example, the impact of the Google core update of May 2022 and how to deal with it, i.e. how to improve a website´s Google search ranking in the future.


Marketing channels are commonly used to provide insight on how visitors arrive to your website, how paid measures or campaigns perform, also compared to non-paid measures, or to filter traffic based on marketing channels. Moreover, the knowledge about the traffic of the different marketing channels helps you, for example, to set up personalization use cases, which are also described on this website.

Marketing channels are not set up automatically by Adobe Analytics. We can support you in the definition of marketing channel processing rules, i.e. what channels you want to track and how you want to track them. Here are some marketing channel examples from a customer project, which are also reflected in the diagram below:

  • Direct: a visitor that comes to your website directly, such as from a favorites link or by pasting a link in their browser.
  • Organic Search: a visitor finds your website through a web search, where the search engine ranked your site without paying for the listing.
  • Paid Search: a visitor comes to the website through a paid placement in search results of a search engine.
  • Internal: a visitor came from within the site to start the visit, e.g. after a session refresh.
  • Campaign - Email: visitors originating from an email campaign.
  • Social Organic: a visitor originates e.g. from facebook, linkedin, twitter.
  • Campaigns - Retargeting: a visitor originates from a retargeting campaign.
  • Social Paid: a visitor originates from a campaign on social channels, e.g. facebook, linkedin, instagram.
marketing-channel
  • In order to get reliable data on marketing channels, it is important that first page hit tracking is set up (free of charge, only service request required). Otherwise the marketing channel of a website visitor cannot be tracked, if marketing cookies are not accepted already, e.g. from a previous visit.

UTM parameters are variants of URL parameters used by marketers to track the effectiveness of online marketing campaigns across traffic sources and publishing media. The UTM parameters in a URL identify the campaign that refers traffic to a specific website, and attributes the browser's website session and the sessions after that until the campaign attribution window expires to it. 

The following utm parameters are most popular:

  • utm_source: used to identify a search engine, newsletter name, or other source, such as linkedin or twitter.
  • utm_medium: used to identify a medium such as email or cost-per-click.
  • utm_content: used to to differentiate ads or links that point to the same URL.
  • utm_campaign: used to identify a specific product promotion or strategic campaign.

To define and append the relevant UTM parameters to the appropriate URLs, you can use simple, spreadsheet-based, or automated UTM builder tools, such as the  Google Analytics URL Builder

Example: URLs for a survey about the oneMarketing sprint review in March 2023 which was accessible via an email sent out through Adobe Campaign and via a QR code. The survey was sent out in the framework of oneMarketing "Engagement Layer" campaign.

The traffic coming through the URLs with the different utm parameter values to your website can be analyzed using Adobe Analytics. As you can see in the screenshot below, you can analyze the values of each utm parameter separately, but also in combination.

AA_UTM_Parameter

Prerequisite is that you follow a consistent utm parameter setup and that utm parameter tracking is set up:

  • evar0 / Tracking code setup in Adobe Launch: e.g. Campaign value equals %c_tracking.utm_source%|%c_tracking.utm_medium%|%c_tracking.utm_campaign%|%c_tracking.utm_content%
  • Classification of the evar0 / Tracking Code values in Adobe Analytics via Classification Rule Builder

We can help you with the setup. The contact details of the ECS team can be found below on this page.  

In most of the scenarios, it is expected than more than one person is working on the same dashboard on regular basis, for example, for monthly or quarterly reporting of activities on your website.

Adobe Analytics offers the options to share the project in Adobe Analytics workspace directly with view, duplicate or edit rights as well as to share the project as PDF or csv-file.

Usually, it makes more sense to share the dashboard directly in the Adobe Analytics workspace and not as a PDF or csv-file. As shown in the images below, by sharing the dashboard in Adobe Analytics directly, all colleagues can make use of the multiple visualization options in Adobe Analytics workspace based on everyone´s needs, such as filtering the data based on dropdown filters, fading information in and out or sorting data.

Example: Filter data by region and / or country of origin of the website visitors
AA_Filters
Example: Fade data in and out based on your country or countries of interest
AA_Fade_in_out

Prerequisite for making dashboards available in the Adobe Analytics workspace is that the users have access to Adobe Analytics. Requesting access to Adobe Analytics for more users does not result in additional costs for you.

Depending on the way of collaboration it makes sense to grant edit, duplicate or view rights to your colleagues for your dashboard.

If you need more consulting regarding collaboration on an Adobe Analytics project, please reach out to the ECS team. You find the contact details below on this page.

If you are a Digital Marketer, chances are you are using social, paid, email, and/or affiliate campaigns to drive click-throughs to your website. While your marketing tool may be showing you a good volume of clicks, it is important to not simply take those numbers at face value. Several factors can inflate click volumes, so before you dedicate your whole budget to an ad platform, it’s important to have an analytics program in place to validate the impact of your campaigns.


  • Clicks” do not equal “Visits”
    Email servers and ad networks usually count the number of “clicks” on a link. This can be very different than the number of “visits” counted in Adobe Analytics. Users can click a button multiple times, whether it be inadvertent, or in frustration because of a long load time. Perhaps the user opened several different links at once to see all the options before clicking again to move forward. In each case, your ad network will count multiple clicks, while Adobe Analytics will only count a visit once in a 30-minute period. 
  • The Click’n’Close
    Ad networks may report clicks from users that never actually reach your site. Users may close their tab or browser before the page load data can be sent to Adobe Analytics.
  • Use of Web Analytics Blockers
    If users are using web analytics blockers, the visits of these users won´t be recorded in Adobe Analytics.
  • Cookies Opt-out / Rejection
    If users opt out or reject the use of marketing cookies, the visits of these users won´t be recorded in Adobe Analytics. 

We recommend to use the number of visits recorded in Adobe Analytics to validate the impact of your campaigns.

You can track website visitor behaviour in journeys, such as quote-and-buy motor & property or FNOL motor & property, and also analyze the collected data using Adobe Analytics. More information about the tracking setup can be found in on the page about the Digital Analytics System. When the tracking is set up we can support you in the analysis of the data.
On most of the websites, users can download documents. If your tracking concept is based on the oneMarketing blueprint, you can analyse the number of downloads using the dimensions "Download Link" in combination with the metric "Download Link Instances". Not only downloads of pdf-files, but also of other files types, such as txt-, xlsx- or jpg-files are shown.
AA_Downloads
Self-Service

Go to the following page Adobe Experience Cloud and login.

You can login with your Allianz email address and your Adobe passwort. If you don´t know your passwort anymore, reset the password. A link to reset your passwort will be sent to your Allianz email address.

AA_Login
AA_Login_Passwort
Please select "Private Profile".

You can find a lot of information about Adobe Analytics components in the Adobe Experience League, e.g.:

  • Dimensions: Reference for dimensions usable in Adobe Analytics.
  • Metrics: Reference for metrics usable in Adobe Analytics.
  • Segmentation: Focus on a subset of your data.
  • Calculated metrics: Use simple formulas to combine metrics, or advanced functions for statistical analysis.
  • Virtual report suites: Create a virtual silo of data based on a report suite. Allows the ability to cleanse or segment data for a better user experience. Some features can only be used in virtual report suites.
  • Cross-Device Analytics: A special type of virtual report suite allows you do configure Cross-Device Analytics.
  • Alerts: Receive notifications any time data goes above or below a threshold.
  • Classifications: Reorganize and group dimensions to obtain additional insight.
  • Real-time reporting: Get reports and trends the minute they are available.
  • Marketing channels: Understand how visitors arrive to your site and determine which channels are most successful.

If you have have questions regarding the information you find there or how the information relates to your specific website, reach out to the ECS team.

Group Strategy, Marketing, Distribution (GSMD) is offering subscription to the Adobe All Access Learning Path for free for Allianz employees, where you will find 1 day / 2day / 3 day classroom trainings per Adobe Marketing Suite solutions, not only for Adobe Analytics.

The "Adobe Analytics Insights Generation" services offered by oneMarketing is targeted, dealing with the topics as per the customer needs, end-to-end focused on the customer, without wasting a lot of time and energy.. The service allows customers to work step-by-step through their specific requirements for an Adobe Analytics dashboard, acquire the knowledge in a targeted way in individual sessions and also rely on support for future questions regarding the data. Within the service you do not only learn how to use Adobe Analytics, but also how to connect the insights from Adobe Analytics to your marketing and sales strategy.

In contrast to the "Adobe Analytics Insights Generation" service offered by oneMarketing, the trainings provided by Adobe within the All Access Learning Path are based on exemplary websites and exemplary data. You first need to filter all information you get in the trainings to apply it to your own use cases. This requires a lot of time invest on your side. Moreover, you will probably still need some support from oneMarketing Analytics specialists regarding the Allianz- and OE-specific Analytics setup. Nevertheless, you can use the Adobe All Access Learning Path to get certification that may be valuable for your CV.

Yes, they need to have a Allianz email address and then can apply for access as every Allianz employee.
Pricing

The price depends on the OE requirements, e.g.:

  • Topic-specific workshop: 3-5 PD in total (820€ per PD) 
  • Regular consulting service: 1-3 PD per month (820€ per PD)